
Background
This web site arose after a review of Australia’s stock assessment practices. From this study, many Australian assessments were defined as bespoke. Although there was often good reason for this, several assessments could have been undertaken using peer-reviewed, well tested and documented, freely available packages, with a large support base of users and developers. When assessment scientists were asked why bespoke packages were used extensively in Australia, a key issue was finding packages that would suit their use and whether training was available. This web site, we hope, will be a tool for all assessment scientists wanting to find a package that is appropriate for their needs. However, we do not intend for this web site to lead you to a single “best” assessment. This might be the role of other tools. We provide our recommendations regarding packages, but this remains our own opinions.
The project conducted an in-depth search of freely available packages. Initially, about 135 packages were found. Of these, about 63 were removed from the list. The main reasons for the removals were that the packages were either:
- No longer supported or freely available,
- Had since been replaced by a more modern approach by the developer (or others),
- Not ultimately an assessment (as defined on the Purpose of this site page) or
- Not a package – rather bespoke code and as such not supported by the developer for general use.
Most of the removed package fell into the fourth group. It is unfortunate that so many very good and generalizable methods were not developed further into packages for the stock assessment community.
Another observation during this project is that more data-rich packages are being (or have been) modified to be able to undertake data-limited and -moderate assessments. This is a very exciting development.
This web site is regularly reviewed and updated, including the list of packages, their specifications and web links. New packages are added and some are deleted if inactive for a long period or no longer supported by the author(s). Presently there are about 77 assessment packages that appear in the table below.
We would like to acknowledge the initial inputs from CAPAM, especially drs Mark Maunder and Simon Hoyle who created the original list and information. Of course, the detailed information is usually provided by the project team with help from the package developer, whose inputs have been invaluable.
The full methods are described in Dichmont, et al. 2021. Collating stock assessment packages to improve stock assessments. Fisheries Research. Volume 236, April 2021, 105844
Package types
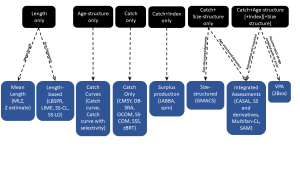
A first step was to classify the packages into different types. There are:
- Catch curve: catch curve analysis is a method for estimating the total mortality of a stock (Z) from the slope of the relative numbers present in each age or length class.
- Catch only: there is a large group of packages that use mainly or only catch data to assess the status of a stock. It should be noted that catch only methods include expansive assumptions such as an open access and unmanaged fishery. In most cases in the world, the assumptions behind catch only methods do not apply and can results in imprecise and biased estimates of stock status. Several papers have been written on these methods, including Free et al (2019 – https://doi.org/10.1016/j.fishres.2019.105452), Pons et al (2020 – https://doi.org/10.1139/cjfas-2019-0276) and Dai et al (2023 – https://doi.org/10.1016/j.fishres.2022.106520). These methods should therefore be used with caution.
- Delay difference: these assessment approaches are mid-way in complexity between surplus production models and full age-structured assessments. Delay difference models represent the population using two stages – recruits and spawners.
- Depletion model: few packages fell in this category. This assessment methods model in-season catch dynamics and are different enough to stand on their own.
- Integrated assessment: these are assessments that are based on age- or length- structured (or both) population dynamics models and integrates data from various disparate sources into a single framework for parameter estimation.
- Length-based: these are data-limited or -moderate approaches that use length data to estimate mortality and length-based reference points.
- Mean length: these data-limited assessments use a time series of mean lengths to estimate mortality and length-based reference points.
- Size-structured: are data-rich integrated assessments that are similar to age-based integrated assessments, but are aimed at hard to age species such as crustaceans and abalone that use at their basis size-frequency data. Only one package falls into this category despite these assessments being very common.
- Surplus production: surplus production models are one of the simplest approaches that nevertheless represent stock dynamics. Here the population is placed in a dynamic pool. It does not keep track of age or length structure. A new category of surplus production models has been created – age-structured production models – to allow for age and index data models.
- VPA: Virtual Population Analyses are a class of age-structured models that are based on the assumption that the catch-at-age data are known with negligible error. Many assessments previously conducted using VPA are now being conducted using integrated methods.
The following flow diagram illustrates the ten classes, with a few package examples:
Package specifications
In order to facilitate the use of this web site, we thought it would be useful to have reasonably detailed specifications for each package. These can be found by clicking the Details button for a specific package in the table below. We thank the developers for their input (either as part of a CAPAM census to which we added further information) or by the project team. This dataset has been checked by several developers and other stock assessment experts, but may still need input from anyone who notices discrepancies. The Contact us page is available for this purpose. Another option is to use this Survey where you can add the requested details in a more structured manner (our preferred way).
Package status
The final step was to Comment on the package and provide a Status remark. The categories are:
- Supported: A package that is maintained and is based on a statistically and mathematically appropriate analysis method (about 20 packages).
- Supported and Recommended: Packages classified within each class of assessment methods as ‘Supported and Recommended’ using the the qualitative criteria described in Table 3 of the above-mentioned paper (noting that not all criteria are applicable to all types of assessments) (~31 packages):
- their support of multiple functional forms for biological processes (e.g., types of selectivity patterns for methods based on age- and size-structured models;
- whether allowance can be made for process and observation error for surplus production models), and the breadth of the types of data that can be used for parameter estimation;
- whether the packages / methods have been subjected to testing using simulation by analysts other than the package developers and are being applied in more than a single case;
- whether documentation is available in the form of peer-reviewed publications;
- whether a technical user manual and documentation are available;
- the size of the current user base that identified potential bugs and provides suggestions for updates, and the responsiveness of the development team to these comments; and
- whether the method applies state-of-the-art statistical estimation methods and can adequately quantify the uncertainty of model outputs. When multiple implementations of the same basic approach are available, we have recommended the version we have found easiest to use. Note that the methods are recommended within assessment types and are all hence not equally preferred. For example, we would also advocate the use of assessment methods that utilize all of the available data over methods that rely only on catch data.
- Inactive: The package has not been modified for several years (~8 packages).
- Not evaluated: Packages that are new and are not yet actively used or peer-reviewed (~3 packages). This status may change over time.
- Still under development: A new package that will replace an existing package, but the process is not yet completed (presently no packages).
- Superseded: The method is no longer being updated by the developer, but is still being used in some cases (~14 packages).
The below table is a summary of a much larger table containing extensive specification for each package we have included. They range from data-limited to data-rich. If you see any missing packages or any of the data is incorrect please Contact Us.
The complete list with specifications can be downloaded here: Packages spreadsheet
Table filters
Some basic instructions about the table:
- You can sort any of the column headings.
- You can filter various aspects of the table. The filter options allow you to click more than one option.
- You can search for words in the table. This search is quite broad.
- Package status may be useful to narrow the list of packages down, noting that the category “Supported and Recommended” are packages we recommend. This filter can be combined with the filer “Type” which will help to further reduce the final list of packages.
- The full table of package information is downloadable at the bottom of the page.
There are 2 columns with live links:
- The last column (Details) links to a detailed description and allied specifications of the chosen package.
- The second column (Web link) links to the package.
December 2023
| Name | Web.link | Type | Single.multiple.spp | Package status | Comment | FullName | Description | Developers | Organization | Training | Expertise | Citation | Peer.reviewed | Programming.language | GUI | R.package | Temporal.resolution | Sex.structure | Multi.species.technical.interactions | Growth.platoons | Tagging | Area.structure | Spatial.resolution | Stock.structure | Logistic | Double.normal | Spline.1 | Parameter.for.each.age.nonparametric | Other.21 | Seasonal | Maximum.likelihood | Bayesian | Random.effects.state.space | Catch | Retained | Discarded | Length.composition | Age.composition | Weight.composition | Conditional.age.at.length | Mean.weight.at.age | Mean.length.at.age | Sex | Morph.composition | Aging.error | Custom.composition.bin.size | Stock.origin | Other.3 | Index.of.abundance | Index.of.effort | Fishing.mortality | Absolute.estimate.of.abundance | Environmental.index..of.a.parameter.random.effect. | Other.4 | Mark.recapture..to.estimate.movement.and.or.F.or.B. | Growth.increment | Close.kin | Gene.tagging..Maybe.some.special.requirements. | Other.5 | MSY | FMSY | SPRx | Spawning.biomass.per.recruit | Biomass.target | Dynamic.B0 | Random.deviates | Normal.approximation | Parameter.uncertainty | Fishery.impact.plots | Other.29 | Short-lived species |
|---|---|---|---|---|---|---|---|---|---|---|---|---|---|---|---|---|---|---|---|---|---|---|---|---|---|---|---|---|---|---|---|---|---|---|---|---|---|---|---|---|---|---|---|---|---|---|---|---|---|---|---|---|---|---|---|---|---|---|---|---|---|---|---|---|---|---|---|---|---|---|---|
| 2BOX | https://noaa-fisheries-integrated-toolbox.github.io/2BOX | VPA | Single species | Inactive | Declared Inactive by NOAA. Not ideal for Australian fisheries, because the package needs catch-at-age data for every year. Statistical Catch-At-Age models such as SS an CASAL can utilise datasets with missing years of catch-at-age data. Not being maintained so executiable difficult to get to run on modern systems. | Dual Zone Virtual Population Analysis | "The Dual Zone VPA Model (VPA-2BOX) is a flexible software tool for analyzing the abundance and mortality of exploited animal populations that is based on the ADAPT framework developed by Parrack (1986) and Gavaris (1988). The primary difference between this package and other versions of ADAPT is the capability of analyzing two different stocks simultaneously, making possible routine quantitative analyses of the effect of sex-specific growth or stock intermixing. In addition, a wide variety of options are provided with respect to the types of data that may be used and the way the parameters are estimated. " | Clay Porch | NOAA/NMFS/SEFSC | No | Medium | Porch, C.E, S.C. Turner and J.E. Powers. 2001. Virtual population analyses of Atlantic bluefin tuna with alternative models of transatlantic migration: 1970-1997. ICCAT Collective Volume of Scientific Papers 52 (3): 1022-45. https://www.iccat.int/Documents/CVSP/CV052_2001/n_3/CV052031022.pdf (Last accessed 1/11/2023). | Yes | FORTRAN | Yes | No | Annual | Yes | No | No | Yes | Yes | Two zones | Yes | No | No | No | No | Yes - see reference citation | No | Yes | Yes | Yes | Yes | No | No | No | Yes | No | No | No | No | Yes | No | No | No | No | No | No | No | No | No | No | No | No | No | No | No | No | No | No | No | Yes | No | No | No | No | No | No | No | Yes; annual time step |
| AMAK | https://github.com/nmfs-toolbox/amak | Integrated assessment | Single species | Inactive | Has not been updated in the Github for 2 years. SAM, SS or CASAL are alternatives as they have more features. Designed for Alaskan fisheries. GitHub code last changed May 2021. Not on the new NMFS software repository. Documentation not updated since 2014. | Assessment Method For Alaska | "The Assessment Method for Alaska (AMAK) was developed in the NMFS Alaska Fisheries Science Center by Dr. James Ianelli using AD Model Builder. This is an age based estimation model that supports multiple fisheries and sparse data availability. The AMAK model is an explicit age-structured model that uses a forward projection approach and maximum likelihood estimation to solve for model parameters." | Jim Ianelli | NMFS Alaska Fisheries Science Center | No | High | Anon, 2014 https://github.com/NMFS-toolbox/AMAK/blob/master/docs/AMAK%20Documentation.pdf (Last accessed 1/11/2023) | Yes | ADMB | Yes | No | Annual | No | No | No | No | No | Stock | No | Yes | Yes | No | No | No | No | Yes | No | No | Yes | No | No | No | Yes | Yes | No | Yes | No | No | No | No | No | No | No | Yes | No | No | No | No | No | No | No | No | No | No | Yes | Yes | No | Yes | Yes | No | Yes | Yes | Yes | Yes | No | Yes; annual time step |
| ASAP | https://noaa-fisheries-integrated-toolbox.github.io/ASAP | Integrated assessment | Single species | Superseded | SAM, SS or CASAL may be alternatives as they have more features. Used mainly within the USA. | ASAP | "The Age Structured Assessment Program (ASAP) is an age-structured model that uses forward computations assuming separability of fishing mortality into year and age components to estimate population sizes given observed catches, catch-at-age, and indices of abundance. Discards can be treated explicitly. The separability assumption is relaxed by allowing for fleet-specific computations and by allowing the selectivity at age to change smoothly over time or in blocks of years. The software can also allow the catchability associated with each abundance index to vary smoothly with time. The problem’s dimensions (number of ages, years, fleets and abundance indices) are defined at input and limited by hardware only. The input is arranged assuming data is available for most years, but missing years are allowed. The model currently does not allow use of length data nor indices of survival rates. Diagnostics include index fits, residuals in catch and catch-at-age, and effective sample size calculations. Weights are input for different components of the objective function and allow for relatively simple age-structured production model type models up to fully parameterized models. The calculation engine was built using AD Model Builder by Drs. Christopher M. Legault (currently at the NMFS Northeast Fisheries Science Center) and Victor R. Restrepo (currently at the NMFS Southeast Fisheries Science Center). ASAP has been used as an assessment tool for red grouper (SEFSC), yellowtail flounder (NEFSC), Pacific sardine (SWFSC), Pacific mackerel (SWFSC), Greenland halibut (ICES), Norther Gulf of St. Lawrence cod (DFO), Gulf of Maine cod (NEFSC), Florida lobster (FFWCC), and fluke (NEFSC)." | Chris Legault and Victor Restrepo | NMFS | Yes | High | Legault CM, Restrepo VR. 1999. A flexible forward age-structured assessment program. ICCAT Working DocumentSCRS/98/58. 15p. https://www.researchgate.net/publication/266334996_A_Flexible_Forward_Age-Structured_Assessment_Program (Last accessed 2/11/2023). | Yes | ADMB | Yes | Yes | Annual | No | No | No | No | No | Stock | No | Yes | No | No | Yes | Double logistic | No | Yes | Yes | No | Yes | Yes | Yes | No | Yes | Yes | No | No | No | No | No | No | No | No | No | Yes | No | No | Yes | No | No | No | No | No | No | No | Yes | Yes | No | Yes | No | No | No | Yes | No | No | No | Yes; annual time step |
| ASPIC | https://noaa-fisheries-integrated-toolbox.github.io/ASPIC | Surplus production | Single species | Inactive | Inactive, we recommend JABBA and spm | A Stock Production Model Incorporating Covariates (ASPIC) | "A non-equilibrium implementation of the well-known surplus production model of Schaefer (1954, 1957). ASPIC also fits the generalized stock production model of Pella and Tomlinson (1969) using the alternative parameterization of Fletcher (1978).The analytic engine for the ASPIC model, written by Dr. Michael Prager of the Southeast Fisheries Science Center, NMFS, incorporates several extensions to the classical stock-production models. ASPIC can fit data from up to 10 data series of fishery-dependent or fishery-independent indices, and uses bootstrapping to construct approximate nonparametric confidence intervals and to correct for bias." | Michael Prager | NOAA/NMFS | Unknown | Medium | Prager, M. H. 1992. ASPIC: A Surplus-Production Model Incorporating Covariates. Coll. Vol. Sci. Pap., Int. Comm. Conserv. Atl. Tunas (ICCAT) 28: 218–229. | Yes | FORTRAN | Yes | No | Annual | No | No | No | No | No | Stock | No | No | No | No | No | No | No | Yes | No | No | Yes | Yes | Ideally added in | No | No | No | No | No | No | No | No | No | No | No | No | Yes | Yes | No | No | No | No | No | No | No | No | No | Yes | Yes | No | Yes | No | No | No | No | No | No | No | No |
| aspm | https://github.com/haddonm/datalowSA | Age-structured production model | Single species | Supported | Unlike most surplus production models, this version is based on an age-structured surplus production. However, we recommend SS-DL, SS or CASAL as alternatives, because they have more features and are actively updated. | Age-structured production model | "The age-structured production model (ASPM or aspm) is literally a surplus production model which is based up and age-structured model of production rather than an accumulated biomass model (e.g. spm)" | Malcolm Haddon | Malcolm Haddon Consulting | No | Medium | https://github.com/haddonm/datalowSADocs/blob/master/Vignette_for_aspm.pdf (Last accessed 2 November 2023) | No | R | No | Yes | Annual | No | No | No | No | No | Stock | No | No | No | No | No | No | No | Yes | No | No | Yes | No | No | No | No | No | No | Yes | Yes | No | No | No | No | No | No | Yes | No | No | No | No | No | No | No | No | No | No | Yes | Yes | No | No | Yes | No | No | No | Yes | Yes | No | No |
| BSM | https://github.com/cfree14/datalimited2 | Surplus production | Single species | Superseded | Superseded, we recommend JABBA and spm | Bayesian state-space surplus production model | "Estimates biomass, fishing mortality, and stock status (i.e., B/BMSY, F/FMSY) time series and biological/management quantities (i.e., r, K, MSY, BMSY, FMSY) from a time series of catch and a resilience estimate using the Bayesian surplus production model from Froese et al. 2017." | Christopher M. Free | Department of Marine and Coastal Sciences, Rutgers University, New Brunswick, NJ, USA | No | Medium | Free CM (2018) datalimited2: More stock assessment methods for data-limited fisheries. R package version 0.1.0. https://github.com/cfree14/datalimited2; Froese R, Demirel N, Coro G, Kleisner KM, Winker H (2017) Estimating fisheries reference points from catch and resilience. Fish & Fisheries 18(3): 506-526. https://doi.org/10.1111/faf.12190 (Last accessed 2/11/2023) | Yes | JAG | No | Yes | Annual | No | No | No | No | No | Stock | No | No | No | No | No | No | No | No | Yes | No | Yes | No | No | No | No | No | No | No | No | No | No | No | No | No | No | Yes | No | Yes | Yes | No | No | No | No | No | No | No | Yes | Yes | No | Yes | Yes | Yes | No | No | Yes | No | No | No |
| CASAL2 | https://github.com/NIWAFisheriesModelling/CASAL2 | Integrated assessment | Single species | Supported and Recommended | Based on CASAL. SS is an alternative that also has many features. Used globally. Can be used to develop a fully size or age structured assessment. | C++ Algorithmic Stock Assessment Laboratory v2 | The Casal2 software implements a generalised age- or size-structured population model that allows for a great deal of choice in specifying the population dynamics, parameter estimation, and model outputs. Casal2 is designed for flexibility. It can implement an age-structured model for a single population or multiple populations using user-defined categories such as area, sex, and maturity. These structural elements are generic and not predefined, and are easily constructed. Casal2 models can be used for a single population with a single anthropogenic event (in a fish population model this would be a single fishery), or for multiple species and populations, areas, and/or anthropogenic or exploitation methods, and including predator-prey interactions. In Casal2 the processes in a time period and within an annual cycle are defined by the user. Observation data used for model fitting can be from many different sources, like, removals-at-size or -age from an anthropogenic or exploitation event (e.g., fishery or other human impact), research survey and other biomass indices, and mark-recapture data. Model parameters can be estimated using penalised maximum likelihood or Bayesian methods. As well as the point estimates of the parameters, Casal2 can calculate the likelihood or posterior distribution profiles, and can generate Bayesian posterior distributions using Markov chain Monte Carlo methods. Casal2 can project population status using deterministic or stochastic population dynamics. Casal2 can also simulate observations from a set of given model structures. | B. Bull, C. Francis, A. Dunn, A. McKenzie, D. Gilbert, M. Smith, R. Bian, D. Fu | NIWA | No | High | Casal2 Development Team (2023). Casal2 user manual for age-based models, v23.09 (2023-09-16). National Institute of Water & Atmospheric Research Ltd. NIWA Technical Report 139. 268p. https://raw.githubusercontent.com/NIWAFisheriesModelling/CASAL2/master/Documentation/UserManual/CASAL2_Age.pdf (Last accessed 2/11/2023) | No | C++ | No | Yes | Annual cycle of time steps defined within a calendar year or as an abstract sequence of events. | Yes | No | Yes | Yes | Yes | Stock | Yes | Yes | Yes | No | Yes | Many other | Yes | Yes | Yes | No | No | Yes | Yes | Yes | Yes | No | Yes | Yes | Yes | Yes | No | Yes | Yes | Yes | Maturation and migration data | Yes | No | Yes | Yes | No | Index to shift A50 in fishing selectivity | Yes | Yes | No | No | No | Yes | Yes | No | No | No | No | Yes | Yes | No | No | No | Yes; seasonal time step |
| Catch and index models (SS-DL) | https://github.com/shcaba/SS-DL-tool | Age-structured production model | Single species | Supported and Recommended | Recommended for catch plus informative index cases. The SS-DL Tool can use a variety of data configurations and is flexible in accommodating any available combination of information. This particular formation uses catch and index data, where the latter is more informative than would warrant the use of XSSS, which uses a prior on depletion to supplement the potential lack of information on the index. | Catch and index (age-structured production) models within SS-DL | Age-structured production models expand the theory of surplus production models by breaking biomass out into age classes. This model type has been used as an alternative to biomass-based production models, and can be used to diagnose the performance of more fully integrated models (e.g., those that use additional data types). XSSS is committed to using the adaptive importance sampling routine (AIS) to estimate uncertaity, wheres the age-structured production model can use asymptotic variance estimation, as well as other Bayesian approaches such as MCMC. | Jason Cope | NOAA | Yes | Medium | Maunder, M.N., Piner, K.R., 2015. Contemporary fisheries stock assessment: many issues still remain. ICES J. Mar. Sci. 72, 7–18, https://doi.org/10.1093/icesjms/fsu015 (Last accessed 2/11/2023) Carvalho, F., Punt, A.E., Chang, Y.-J., Maunder, M.N., Piner, K.R., 2017. Can diagnostic tests help identify model misspecification in integrated stock assessments? Fish. Res. 192, 28–40. https://doi.org/10.1016/j.fishres.2016.09.018. Carvalho, F., Winker, H., Courtney, D., Kapur, M., Kell, L., Cardinale, M., Schirripa, M., Kitakado, T., Yemane, D., Piner, K.R., Maunder, M.N., Taylor, I., Wetzel, C.R., Doering, K., Johnson, K.F., Methot, R.D., 2021. A cookbook for using model diagnostics in integrated stock assessments. Fisheries Research 240, 105959. https://doi.org/10.1016/j.fishres.2021.105959 Minte-Vera, C.V., Maunder, M.N., Aires-da-Silva, A.M., Satoh, K., Uosaki, K., 2017. Get the biology right, or use size-composition data at your own risk. Fish. Res. 192, 114–125. https://doi.org/10.1016/j.fishres.2017.01.014. | Yes | ADMB, R, Rshiny | Yes | Yes | User specified | Yes | No | Yes | No | No | Single area | No | Yes | Yes | Yes | Yes | No | User specified | Yes | Yes | No | Yes | Yes | Optional - but ideally should be considering total removals | No | No | No | No | No | No | Yes | Yes | No | Yes | Yes | No | Yes | Yes (if CPUE is being used as proxy abundance index) | No | Yes | No | No | No | No | No | No | No | Yes | No | No | No | No | Yes | No | No | Yes | Yes | No | No |
| Catch curve (datalowSA) | https://github.com/haddonm/datalowSA | Catch curve | Single species | Supported | We recommend "Catch curve with selectivity" or "Catch curve (TropFishR)" because they better account for selectivity | Classical catch curves (F) | Catch curve analysis is a method for estimating the total mortality of a stock (Z): the rate at which individuals die can be estimated from the slope of the relative numbers present in each age class. It can be used whenever there is one or more years of catch-at-age data (or at-length data, if it can be converted to age). The data can be fishery dependent or independent so long as data are representative of the population's relative age/length structure. Given an estimate of natural mortality (M) from another source (e.g., from literature, from a marine protected area, or from tagging studies), fishing mortality (F) can be estimated as Z-M. | Malcolm Haddon | Formerly CSIRO, now private | Yes | Low | Haddon, M. Burch, P., Dowling, N., and Little, R. 2019. Reducing the Number of Undefined Species in Future Status of Australian Fish Stocks Reports: Phase Two - training in the assessment of data-poor stocks. FRDC Final Report 2017/102. CSIRO Oceans and Atmosphere and Fisheries Research Development Corporation. Hobart 125 p. https://www.frdc.com.au/Archived-Reports/FRDC%20Projects/2017-102-DLD.pdf (Last accessed 2/11/2023) | No | R | No | Yes | User specified | No; but user should undertake sex-specific analysis if sex-specific life history available | No | No | No | No | Single area | No | Yes | No | No | No | No | User specified | Yes | No | No | No | No | No | Yes - in lieu of age composition data | Yes | No | Yes | No | No | No | No | No | Yes | No | No | No | No | No | No | No | No | No | No | No | No | No | No | No | No | No | No | No | No | No | No | No | No | Yes; but not recommended with annual time steps |
| Catch curve (fishe) | http://fishe.edf.org/ | Catch curve | Single species | Supported | We recommend "Catch curve with selectivity" or "Catch curve (TropFishR)" because they better account for selectivity. To use the FISHE resources, one needs to download the Excel FISHE Workbook (link under "Resources" or "About"); then under "Step 5 - Initial Fishery Assessments"; then under dropdown "Catch curves - length based" click the link "Length Based Assessment Methods Workbook" (under heading "Resources"); then sheet tab "Catch Curves". For guidance, click the link "Primer for Length-Based Assessment Methods". | Catch curve | From the package: "This method utilizes length-frequency data (fish lengths) to estimate the fishing mortality affecting the fished population. Total mortality (Z) is estimated using the slope of the log transformed age-frequency histogram. Fishing mortality can then be calculated based on the difference between total fishing mortality (F) and M, the natural mortality (F = Z – M)."Catch curve analysis is a method for estimating the total mortality of a stock (Z): the rate at which individuals die can be estimated from the slope of the relative numbers present in each age class. It can be used whenever there is one or more years of catch-at-age data (or at-length data, if it can be converted to age). The data can be fishery dependent or independent so long as data are representative of the population's relative age/length structure. Given an estimate of natural mortality (M) from another source (e.g., from literature, from a marine protected area, or from tagging studies), fishing mortality (F) can be estimated as Z-M. | Rod Fujita | Environmental Defense Fund | Yes | Low | https://fishe.edf.org/framework/step-5-initial-fishery-assessment (Primer For Length-Based Assessment Methods) (Last accessed 2/11/2023) | Yes | Visual Basic (Excel) | No | No | User specified | No; but user should undertake sex-specific analysis if sex-specific life history available | No | No | No | No | Single area | No | Yes | No | No | No | No | User specified | Yes | No | No | No | No | No | Yes - in lieu of age composition data | Yes | No | Yes | No | No | No | No | No | Yes | No | No | No | No | No | No | No | No | No | No | No | No | No | No | No | No | No | No | No | No | No | No | No | No | Yes; but not recommended with annual time steps |
| Catch curve (TropFishR) | https://cran.r-project.org/web/packages/TropFishR/index.html | Catch curve | Single species | Supported and Recommended | Recommended, with guidelines based on our test data set. The package is similar to "Catch curve with selectivity". | Catch curve, or cumulative catch curve | From the package: "A compilation of fish stock assessment methods for the analysis of length-frequency data in the context of data-poor fisheries. Includes methods and examples included in the FAO Manual by P. Sparre and S.C. Venema (1998), "Introduction to tropical fish stock assessment". The function 'catchCurve' This function applies the (length-converted) linearised catch curve to age composition and length frequency data, respectively. It allows to estimate the instantaneous total mortality rate (Z). Optionally, the gear selectivity can be estimated and the cumulative catch curve can be applied." Other: Catch curve analysis is a method for estimating the total mortality of a stock (Z): the rate at which individuals die can be estimated from the slope of the relative numbers present in each age class. It can be used whenever there is one or more years of catch-at-age data (or at-length data, if it can be converted to age). The data can be fishery dependent or independent so long as data are representative of the population's relative age/length structure. Given an estimate of natural mortality (M) from another source (e.g., from literature, from a marine protected area, or from tagging studies), fishing mortality (F) can be estimated as Z-M. | Tobias K. Mildenberger, Marc H. Taylor, Matthias Wolff | Technical University of Denmark; DTU National Institute of Aquatic Resources | Yes | Low | Sparre, P. and Venema, S.C. (1998). "Introduction to tropical fish stock assessment" FAO Manual. FAO, Rome, Italy. http://www.fao.org/documents/card/en/c/9bb12a06-2f05-5dcb-a6ca-2d6dd3080f65/ (Last accessed 2/11/2023) | Yes | R | No | Yes | User specified | No; but user should undertake sex-specific analysis if sex-specific life history available | No | No | No | No | Single area | No | Yes | No | No | No | No | User specified | Yes | No | No | Yes, if cumulative catch curve applied | Yes, if cumulative catch curve applied | Yes, if cumulative catch curve applied | Yes - in lieu of age composition data | Yes | No | Yes | No | No | No | No | No | Yes | No | No | No | No | No | No | No | No | No | No | No | No | No | No | No | No | No | No | No | No | No | Yes | No | No | Yes; but not recommended with annual time steps |
| Catch curve with selectivity | https://github.com/haddonm/datalowSA | Catch curve | Single species | Supported and Recommended | Recommended, with guidelines based on our test data set. The package is similar to "Catch curve (Tropfish)". | Catch curves with selectivity (F) | This catch curve uses a simple age-structured model to include the estimation of selectivity from the age data. It provides an estimate of fully selected fishing mortality rather than an average fishing mortality applied to all included age classes. Catch curve analysis is a method for estimating the total mortality of a stock (Z): the rate at which individuals die can be estimated from the slope of the relative numbers present in each age class. It can be used whenever there is one or more years of catch-at-age data (or at-length data, if it can be converted to age). The data can be fishery dependent or independent so long as data are representative of the population’s relative age/length structure. Given an estimate of natural mortality (M) from another source (e.g., from literature, from a marine protected area, or from tagging studies), fishing mortality (F) can be estimated as Z-M. | Malcolm Haddon | Formerly CSIRO, now private | Yes | Low | Haddon, M. Burch, P., Dowling, N., and Little, R. 2019. Reducing the Number of Undefined Species in Future Status of Australian Fish Stocks Reports: Phase Two - training in the assessment of data-poor stocks. FRDC Final Report 2017/102. CSIRO Oceans and Atmosphere and Fisheries Research Development Corporation. Hobart 125 p. https://www.frdc.com.au/Archived-Reports/FRDC%20Projects/2017-102-DLD.pdf (Last accessed 2/11/2023) | No | R | No | Yes | User specified | No; but user should undertake sex-specific analysis if sex-specific life history available | No | No | No | No | Single area | No | Yes | No | No | No | No | User specified | Yes | No | No | No | No | No | Yes - in lieu of age composition data | Yes | No | Yes | No | No | No | No | No | Yes | No | No | No | No | No | No | No | No | No | No | No | No | No | No | No | No | No | No | No | No | No | No | No | No | Yes; but not recommended with annual time steps |
| CatchMSY (datalimited) | https://github.com/datalimited/datalimited | Catch only | Single species | Superseded | Superseded by CMSY approaches (e.g., cMSY in "datalowSA", or cmsy2 in "datalimited2") | Catch MSY | From the package: "The package implements the methods used in Rosenberg et al. (2014) including Catch-MSY based on Martell and Froese (2013)". Other: The Catch-MSY and the updated version CMSY (Froese et al. 2017) are Monte-Carlo based methods that estimates maximum sustainable yield (MSY) from a time series of catch data, resilience of the species being assessed, and expert judgment regarding stock size during the first and terminal year of the time series. Upon completion of the assessment, estimates are provided for MSY, Fmsy, Bmsy, relative stock size (B/Bmsy), and exploitation (F/Fmsy). The method partially relies on an equilibrium-based Schaefer production model and requires priors on depletion and resilience, so the lower margin of error in terms of MSY estimates should be used in accordance with precautionary management practices. | Sean Anderson | Pacific Biological Station, Fisheries and Oceans Canada, Nanaimo, British Columbia | Unknown | Low | Rosenberg, A. A., M. J. Fogarty, A. B. Cooper, M. Dickey-Collas, E. A. Fulton, N. L. Gutiérrez, K. J. W. Hyde, K. M. Kleisner, C. Longo, C. V. Minte-Vera, C. Minto, I. Mosqueira, G. C. Osio, D. Ovando, E. R. Selig, J. T. Thorson, and Y. Ye. 2014. Developing new approaches to global stock status assessment and fishery production potential of the seas. FAO Fisheries and Aquaculture Circular, Rome, Italy. http://www.fao.org/3/i3491e/i3491e.pdf (Last accessed 2/11/2023) | Yes | R | No | Yes | User specified | No: there is no differentiation between sexes in r and K, and no other biological input | No | No | No | No | Single area | No | Implied | No | No | No | No | User specified | No | Yes - Monte Carlo; posteriors modified due to filtering process | No | Yes | Yes | Optional - but ideally should be considering total removals | No | No | No | No | No | No | No | No | No | No | No | No | No | No | No | No | No | No | No | No | No | No | No | Yes | No - because you provide this via r | No | No | No | No | No | No | Yes | Yes | No | No |
| CatchMSY (fishmethods) | https://cran.r-project.org/web/packages/fishmethods/index.html | Catch only | Single species | Superseded | Superseded by CMSY approaches (e.g., cMSY in "datalowSA", or cmsy2 in "datalimited2") | Catch MSY | From the package: "The method of Martell and Froese (2012) is used to produce estimates of MSY where only catch and information on resilience is known." Other: The Catch-MSY and the updated version CMSY (Froese et al. 2017) are Monte-Carlo based methods that estimates maximum sustainable yield (MSY) from a time series of catch data, resilience of the species being assessed, and expert judgment regarding stock size during the first and terminal year of the time series. Upon completion of the assessment, estimates are provided for MSY, Fmsy, Bmsy, relative stock size (B/Bmsy), and exploitation (F/Fmsy). The method partially relies on an equilibrium-based Schaefer production model and requires priors on depletion and resilience, so the lower margin of error in terms of MSY estimates should be used in accordance with precautionary management practices. (ref: Froese, R., Demirel, N., Coro, G., Kleisner, K. and Winkler, H. 2017. Estimating fisheries reference points from catch and resilience. Fish and Fisheries 18: 506-526). | Gary A. Nelson | Commonwealth of Massachusetts Division of Marine Fisheries | Unknown | Low | Martell, S. and Froese, R. 2012. A simple method for estimating MSY from catch and resilience. Fish and Fisheries 14(4): 504-514. https://doi.org/10.1111/j.1467-2979.2012.00485.x (Last accessed 2/11/2023) | Unknown | R | No | Yes | User specified | No: there is no differentiation between sexes in r and K, and no other biological input | No | No | No | No | Single area | No | Implied | No | No | No | No | User specified | No | Yes - Monte Carlo; posteriors modified due to filtering process | No | Yes | Yes | Optional - but ideally should be considering total removals | No | No | No | No | No | No | No | No | No | No | No | No | No | No | No | No | No | No | No | No | No | No | No | Yes | No - because you provide this via r | No | No | No | No | No | No | Yes | Yes | No | No |
| CatchMSY (Martell) | https://github.com/smartell/CatchMSY | Catch only | Single species | Superseded | Superseded by CMSY approaches (e.g., cMSY in "datalowSA", or cmsy2 in "datalimited2") | Catch MSY | From the package: "The catchMSY package is intended to be used to determine MSY-based reference points. The catchMSY package is based on the initial work for Martell and Froese (2012), "A simple method for estimating MSY from catch and resilience"." Other: The Catch-MSY and the updated version CMSY (Froese et al. 2017) are Monte-Carlo based methods that estimates maximum sustainable yield (MSY) from a time series of catch data, resilience of the species being assessed, and expert judgment regarding stock size during the first and terminal year of the time series. Upon completion of the assessment, estimates are provided for MSY, Fmsy, Bmsy, relative stock size (B/Bmsy), and exploitation (F/Fmsy). The method partially relies on an equilibrium-based Schaefer production model and requires priors on depletion and resilience, so the lower margin of error in terms of MSY estimates should be used in accordance with precautionary management practices. (ref: Froese, R., Demirel, N., Coro, G., Kleisner, K. and Winkler, H. 2017. Estimating fisheries reference points from catch and resilience. Fish and Fisheries 18: 506-526). | Steve Martell and Merrill Rudd | Sea State Inc., University of Washington | Unknown | Low | Martell, S. and Froese, R. 2012. A simple method for estimating MSY from catch and resilience. Fish and Fisheries 14(4): 504-514. https://doi.org/10.1111/j.1467-2979.2012.00485.x (Last accessed 2/11/2023) | Yes | R | No | Yes | User specified | No: there is no differentiation between sexes in r and K, and no other biological input | No | No | No | No | Single area | No | Implied | No | No | No | No | User specified | No | Yes - Monte Carlo; posteriors modified due to filtering process | No | Yes | Yes | Optional - but ideally should be considering total removals | No | No | No | No | No | No | No | No | No | No | No | No | No | No | No | No | No | No | No | No | No | No | No | Yes | No - because you provide this via r | No | No | No | No | No | No | Yes | Yes | No | No |
| CatDyn | https://rdrr.io/cran/CatDyn/man/CatDyn-package.html | Depletion model | Single species | Supported and Recommended | Designed for short-lived species with within-year recruitment. Recently developed multi-annual versions. | Fishery Stock Assessment by Catch Dynamics Models | "Based on fishery Catch Dynamics instead of fish Population Dynamics (hence CatDyn) and using high-frequency or medium-frequency catch in biomass or numbers, fishing nominal effort, and mean fish body weight by time step, from one or two fishing fleets, estimate stock abundance, natural mortality rate, and fishing operational parameters." Online help available via ??CatDyn in R once package is downloaded. | Ruben H. Roa-Ureta | AZTI Tecnalia, Marine Research Unit | Unknown | Medium | Ruben H. Roa-Ureta (2012). Modeling In-Season Pulses of Recruitment and Hyperstability-Hyperdepletion in the Loligo gahi Fishery of the Falkland Islands with Generalized Depletion Models ICES Journal of Marine Science, 68(8), 1403-1415. https://doi.org/10.1093/icesjms/fss110. Multi-annual application: F.Maynou, M.Demestre, .Martín and P.Sánchez (2021). Application of a multi-annual generalized depletion model to the Mediterranean sandeel fishery in Catalonia. Fisheries Research, 234:105814. https://doi.org/10.1016/j.fishres.2020.105814 (Last accessed 2/11/2023) | Yes | R | No | Yes | Day/week/month/year | No | No | No | No | No | Stock | No | No | No | No | No | No | No | Yes | No | No | Yes | No | No | No | No | No | No | No | No | No | No | No | No | No | No | Yes | Yes | No | No | No | No | No | No | No | No | No | No | No | No | No | No | No | No | No | No | No | No | Yes; user specified time step |
| CC-SRA | https://github.com/James-Thorson/CCSRA | Length-based | Single species | Superseded | SS-CL can be set up similar to CC-SRA. We recommend LBSPR (barefootecologist), LIME or SS-CL. SS-CL is the most flexible. | Catch Curve - Stock Reduction Analysis | CC-SRA combines a catch curve analysis (see this assessment method for more details) and a stock-reduction analysis (see this assessment method for more details) to estimate fishing mortality and sustainable catch. The use of age frequency data theoretically allows one to bypass the requirement for a stock status estimate as an input or prior, which is a typical requirement of many catch-based assessment methods. | James Thorson | NOAA | Yes | Low | Thorson, J.T., and Cope, J.M. 2015. Catch curve stock-reduction analysis: an alternative solution to the catch equation. Fish. Res. 171: 33–41. http://www.sciencedirect.com/science/article/pii/S0165783614001507 | Yes | R | No | Yes | User specified | Method intends that the user is following the female spawning biomass | No | No | No | No | Single area | No | Yes | No | No | No | No | User specified | Yes | Yes - optional | No | Yes | Yes | Optional - but ideally should be considering total removals | Yes - in lieu of age composition data | Yes | No | No | Yes | Yes | Yes | No | No | Yes | No | No | No | No | No | No | No | No | No | No | No | No | No | Yes | No | No | No | No | No | No | No | Yes | Yes | Fishing mortality; SB/SBo | Yes; user specified time step |
| CEDA | https://mrag.co.uk/resources/ceda-version-30 | Surplus production | Single species | Not evaluated | We recommend use of JABBA and spm. | The Catch Effort Data Analysis package | "A PC-based software package for analysing catch, effort and abundance index data. Version 3.0 allows calculation of estimates of current and unexploited stock sizes, catchability and associated population dynamics parameters. Both depletion and several types of stock production (biomass dynamic) models can be fitted, using one of three different assumptions about the distribution of residuals. Both point estimates and bootstrap confidence intervals for the estimated parameters can be calculated. CEDA also includes the facility to do projections of stock size into the future under various scenarios of catch or effort levels, so that different management strategies can be investigated. Output is presented both graphically and textually, and can be printed or saved to disk for further use. As with previous versions of CEDA, the package includes a comprehensive context-sensitive Help system and a detailed example analysis. The download file also includes the graphics server programme required to plot the data." | MRAG | MRAG | No | Medium | Kirkwood,G.P., Auklandm R. and Zara, S. J. (2001) Catch Effort Data Aanalysis(CEDA), Version 3.0. MRAG Ltd, London, UK. | No | Unknown | Yes | No | Annual | No | No | No | No | No | Flexible | No | No | No | No | No | No | No | Yes | No | No | Yes | No | No | No | No | No | No | No | No | No | No | No | No | No | No | Yes | Yes | No | Yes | No | No | No | No | No | No | No | Yes | Yes | No | No | Yes | Yes | No | No | Yes | No | No | No |
| cMSY (datalowSA) | https://github.com/haddonm/datalowSA | Catch only | Single species | Supported and Recommended | Recommended, with guidelines based on our test data set. This package is an alternative to SSS. | Catch MSY | From the package: "The Catch-MSY method described here can be regarded as a model-assisted data-poor method. It uses a form of stock reduction analysis where the productivity of a given stock (its unfished biomass and its reproductive rate) is characterised within the parameters of s simple mathematical model, and how that modelled stock responds to the history of known catch (a stock reduction analysis) forms the basis of the alternative methods used to characterise productivity in management useable terms". Other: The Catch-MSY and the updated version CMSY (Froese et al. 2017) are Monte-Carlo based methods that estimates maximum sustainable yield (MSY) from a time series of catch data, resilience of the species being assessed, and expert judgment regarding stock size during the first and terminal year of the time series. Upon completion of the assessment, estimates are provided for MSY, Fmsy, Bmsy, relative stock size (B/Bmsy), and exploitation (F/Fmsy). The method partially relies on an equilibrium-based Schaefer production model and requires priors on depletion and resilience, so the lower margin of error in terms of MSY estimates should be used in accordance with precautionary management practices. (ref: Froese, R., Demirel, N., Coro, G., Kleisner, K. and Winkler, H. 2017. Estimating fisheries reference points from catch and resilience. Fish and Fisheries 18: 506-526). | Malcolm Haddon | Formerly CSIRO, now private | Yes | Low | Haddon, M. Burch, P., Dowling, N., and Little, R. 2019. Reducing the Number of Undefined Species in Future Status of Australian Fish Stocks Reports: Phase Two - training in the assessment of data-poor stocks. FRDC Final Report 2017/102. CSIRO Oceans and Atmosphere and Fisheries Research Development Corporation. Hobart 125 p. https://www.frdc.com.au/Archived-Reports/FRDC%20Projects/2017-102-DLD.pdf (Last accessed 2/11/2023) | No | R | No | Yes | User specified | No: there is no differentiation between sexes in r and K, and no other biological input | No | No | No | No | Single area | No | Implied | No | No | No | No | User specified | No | Yes - Monte Carlo; posteriors modified due to filtering process | No | Yes | Yes | Optional - but ideally should be considering total removals | No | No | No | No | No | No | No | No | No | No | No | No | No | No | No | No | No | No | No | No | No | No | No | Yes | No - because you provide this via r | No | No | No | No | No | No | Yes | Yes | No | No |
| cmsy (Froese) | https://github.com/SISTA16/cmsy | Catch only | Single species | Superseded | Package has been superseded by CMSY++. Look at our "Supported and Recommended" Catch only versions (cMSY, COM-SIR, DB-SRA, OCOM, SS-COM, SSS, zBRT), as they are updated more regularly, are used more extensively within Australia or are more recent. | Catch MSY | From the package: "The official CMSY method for data-limited stock assessment, per Froese et al. (2016)". Other: This is a Monte-Carlo based method that estimates maximum sustainable yield (MSY) from a time series of catch data, resilience of the species being assessed, and expert judgment regarding stock size during the first and terminal year of the time series. Upon completion of the assessment, estimates are provided for MSY, Fmsy, Bmsy, relative stock size (B/Bmsy), and exploitation (F/Fmsy). The method partially relies on an equilibrium-based Schaefer production model and requires priors on depletion and resilience, so the lower margin of error in terms of MSY estimates should be used in accordance with precautionary management practices. (ref: Froese, R., Demirel, N., Coro, G., Kleisner, K. and Winkler, H. 2016. Estimating fisheries reference points from catch and resilience. Fish and Fisheries 18: 506-526). A high-level User Guide is available at: https://github.com/SISTA16/cmsy/blob/master/CMSY_2019_9f_UserGuide.pdf | Developed by Rainer Froese, Gianpaolo Coro and Henning Winker in 2016, version of November 2019 PDF creation added by Gordon Tsui and Gianpaolo Coro. Correction for effort creep added by RF. Multivariate normal r-k priors added to CMSY by HW, RF and GP in October 2019. Multivariate normal plus observation error on catch added to BSM by HW in November 2019. Retrospective analysis added by GP in November 2019 | GEOMAR Helmholtz Centre for Ocean Research Kiel, Duesternbrooker Weg 20, 24105 Kiel, Germany; Istituto di Scienza e Tecnologie dell’ Informazione “A. Faedo”, Consiglio Nazionale delle Ricerche (CNR), via Moruzzi 1, 56124 Pisa, Italy | Unknown | Low | Froese, R., Demirel, N., Coro, G., Kleisner, K. M., & Winker, H. (2016). Estimating fisheries reference points from catch and resilience. Fish and Fisheries 18(3): 506-526. http://onlinelibrary.wiley.com/doi/10.1111/faf.12190/full https://doi.org/10.1111/faf.12190 (Last accessed 2/11/2023) | Yes | R | No | Yes | User specified | No: there is no differentiation between sexes in r and K, and no other biological input | No | No | No | No | Single area | Can handle multiple stocks sequentially | Implied | No | No | No | No | User specified | No | Yes - Monte Carlo; posteriors modified due to filtering process | No | Yes | Yes | Optional - but ideally should be considering total removals | No | No | No | No | No | No | No | No | No | No | No | No | No | No | No | No | No | No | No | No | No | No | No | Yes | No - because you provide this via r | No | No | No | No | No | No | Yes | Yes | No | No |
| cmsy2 (datalimited2) | https://github.com/cfree14/datalimited2 | Catch only | Single species | Supported | Look at our "Supported and Recommended" Catch only versions (cMSY, COM-SIR, DB-SRA, OCOM, SS-COM, SSS, zBRT), as they are updated more regularly, are used more extensively within Australia or are more recent. | Catch MSY | From the package: "This package implements (among many methods) cMSY from Froese et al. (2017)". Other: The Catch-MSY and the updated version CMSY (Froese et al. 2017) are Monte-Carlo based methods that estimates maximum sustainable yield (MSY) from a time series of catch data, resilience of the species being assessed, and expert judgment regarding stock size during the first and terminal year of the time series. Upon completion of the assessment, estimates are provided for MSY, Fmsy, Bmsy, relative stock size (B/Bmsy), and exploitation (F/Fmsy). The method partially relies on an equilibrium-based Schaefer production model and requires priors on depletion and resilience, so the lower margin of error in terms of MSY estimates should be used in accordance with precautionary management practices. (ref: Froese, R., Demirel, N., Coro, G., Kleisner, K. and Winkler, H. 2016. Estimating fisheries reference points from catch and resilience. Fish and Fisheries 18: 506-526). | Christopher M. Free | Sustainable Fisheries Group, Bren School, UC Santa Barbara, CA, USA | Unknown | Low | Free, C.M., Rudd, M.B., Kleisner, K.M., Thorson, J.T., Longo, C., Minto, C., and Jensen, O.P. (in prep). Multispecies catch-only models for assessing data-limited fisheries. | No | R | No | Yes | User specified | No: there is no differentiation between sexes in r and K, and no other biological input | No | No | No | No | Single area | No | Implied | No | No | No | No | User specified | No | Yes - Monte Carlo; posteriors modified due to filtering process | No | Yes | Yes | Optional - but ideally should be considering total removals | No | No | No | No | No | No | No | No | No | No | No | No | No | No | No | No | No | No | No | No | No | No | No | Yes | No - because you provide this via r | No | No | No | No | No | No | Yes | Yes | No | No |
| PBSAwatea | https://github.com/pbs-software/pbs-awatea | Integrated assessment | Single species | Superseded | NOTE: this package was formerly known as "Coleraine_Awatea". SAM, SS or CASAL may be alternatives as they have more features. Recent activity (after a long break) on GitHib but has a long list of R dependencies. | Coleraine and Awatea | "A general model is developed for salmon run reconstruction based on catch, escapement, and age composition data. The model is based on “groups” of salmon, each of which share the same characteristics but can differ from other groups in run timing, abundance, gear selectivity, and migration routes." | Hilborn, Maunder, Parma, Ernst, Payne, Starr, Hicks, and many others | UW mostly | No | High | Coleraine: a generalized age-structured stock assessment model. User's Manual Version 2.0. SAFS-UW-0116. Revised May 2003. https://digital.lib.washington.edu/researchworks/bitstream/handle/1773/4524/0116.pdf?sequence=1&isAllowed=y (Last accessed 2/11/2023) | No | ADMB | No | No | Annual | Yes | No | No | No | No | Single area | No | Yes | Yes | No | No | No | No | Yes | Yes | No | Yes | No | No | Yes | Yes | No | No | No | No | Yes | No | Yes | Yes | No | No | Yes | No | No | Yes | No | No | No | No | No | No | No | Yes | No | No | No | Yes | No | Yes | Yes | No | No | CSP | Yes; annual time step |
| compSRA (DLMtool) | https://github.com/Blue-Matter/DLMtool | Catch only | Single species | Supported | Stock Reduction Analysis is alternative method to CMSY based on an age-structured model. SSS is an alternative for this method. This package contains age-composition SRA (SPSRA) - a surplus production equivalent of DB-SRA that uses a demographically derived prior for intrinsic rate of increase (McAllister method), and age-composition stock reduction analysis. | Age-composition Stock Reduction Analysis | A stock reduction analysis (SRA) model (see SRA assessments for a description of how these work) is fitted to the age-composition from the last 3 years (or less if fewer data are available) assuming a constant total mortality rate (Z) and used to estimate current stock depletion (D), FMSY, and stock abundance (A). Abundance is estimated in the SRA. FMSY is calculated assuming knife-edge vulnerability at the age of full selection. See the User Guide at https://dlmtool.github.io/DLMtool/userguide/introduction.html, and https://cran.r-project.org/web/packages/DLMtool/DLMtool.pdf for a complete list of assessments and management procedures. | Tom Carruthers and Adrian Hordyk | University of British Columbia | Yes | Medium | Description in list at https://cran.r-project.org/web/packages/DLMtool/DLMtool.pdf. An example of this assesment approach can be seen in Haddon, M., and Sporcic, M. (2018). Draft Blue-Eye Trevalla Tier 5 Eastern Seamount Assessment: Age-structured stock reduction analysis. CSIRO Oceans and Atmosphere, Hobart. 26 p. https://www.afma.gov.au/sites/default/files/blue-eye_trevalla_tier_5_eastern_seamount_age_structured_stock_reduction_analysis_0.pdf (Last accessed 2/11/2023) | Yes | R | No | Yes | User specified | Can be sex-specific if inputs are such | No | No | No | No | Single area | No | Yes | No | No | No | No | User specified | Monte Carlo simulations | Yes | No | Yes | Yes | Optional - but ideally should be considering total removals | No | Yes | No | No | No | No | No | No | No | No | No | No | No | No | No | No | No | No | No | No | No | No | No | No | Yes | No | No | No | No | No | No | Yes | Yes | Model produces estimates current stock depletion (D), FMSY, and stock abundance (A). | No |
| COM-SIR | https://github.com/datalimited/datalimited | Catch only | Single species | Supported and Recommended | Bayesian alternative method to, for example, cMSY (datalowSA). SSS has similar features | Catch Only Model - Sampling Importance Resampling Model | From the package: "Catch-only model with sampling-importance-resampling based on the method described in Vasconcellos and Cochrane (2005)." Other: COM-SIR is a catch estimation method (COM) that combines a harvest dynamics model and a biomass dynamics (Schaffer) model in order to estimate maximum sustainable yield (MSY). Catch estimation is made using the Bayesian method of sampling importance resampling (SIR). The model used can be sensitive to changes in harvest dynamics over time, necessitating a different harvest dynamic formulation if this occurs (e.g., due to management). Another approach is to fit the model only to the time series without implemented management measures. | Sean Anderson | Pacific Biological Station, Fisheries and Oceans Canada, Nanaimo, British Columbia | Unknown | Low | Vasconcellos, M., and K. Cochrane. 2005. Overview of World Status of Data-Limited Fisheries: Inferences from Landings Statistics. Pages 1-20 in G. H. Kruse, V. F. Gallucci, D. E. Hay, R. I. Perry, R. M. Peterman, T. C. Shirley, P. D. Spencer, B. Wilson, and D. Woodby, editors. Fisheries Assessment and Management in Data-Limited Situations. Alaska Sea Grant, University of Alaska Fairbanks. eBook available as a free download at https://seagrant.uaf.edu/bookstore/pubs/AK-SG-05-02.html (Last accessed 2/11/2023) | Yes | R | No | Yes | User specified | Method intends that the user is following the female spawning biomass | No | No | No | No | Single area | No | Yes | No | No | No | No | User specified | Yes (in sampling-importance resampling) | Yes | No | Yes | Yes | Optional - but ideally should be considering total removals | No | No | No | No | No | No | No | No | No | No | No | No | No | Yes | No | No | No | No | No | No | No | No | No | Yes | No | No | No | No | No | No | No | Yes | Yes | No | No |
| CSA | https://noaa-fisheries-integrated-toolbox.github.io/CSA | Delay difference | Single species | Inactive | No longer updated. Consider using CASAL instead | Collie-Sissenwine Analysis | "The Collie-Sissenwine Analysis (CSA) model (sometimes called catch-survey analysis or the DeLury model) is a relatively simple two-stage stock assessment model that estimates abundance, fishing mortality and recruitment using total catch numbers and survey data (Collie and Sissenwine 1983; Conser 1995). The “recruit” stage group consists of animals that recruit at, just before, or during the current time step. The rest of the population comprises the “post-recruit” stage group. The two stages may correspond to age groups, length groups or any other natural division (e.g. genders in hermaphroditic species). Typically, both groups are assumed fully available to the fishery but this assumption can be relaxed in practice if fishing mortality rates are viewed as rates for fully recruited animals." | Seaver, A | NOAA/NMFS | No | Medium | Collie, J. S. and M. P. Sissenwine, 1983. Estimating population size from relative abundance data measured with error. Can. J. Fish. Aquat. Sci., 40: 1871-1879. https://doi.org/10.1139/f83-217 (Last accessed 1/11/2023) | Yes | ADMB | Yes | No | Annual | No | No | No | No | No | Single area | No | No | No | No | No | No | No | Yes | No | No | Yes | Yes | Yes | No | No | No | No | No | No | No | No | No | No | No | No | Yes | No | No | No | No | No | No | No | No | No | No | No | No | No | No | No | No | No | No | Yes | No | No | Yes; annual time step |
| DB-SRA (DLMTool) | https://github.com/Blue-Matter/DLMtool | Catch only | Single species | Supported and Recommended | Requires a full catch series. SSS could be an alternative given it has greater flexibility by being based on an age-structured model. However, DB-SRA has more flexibility in the production function. Several resources are available on https://www.datalimitedtoolkit.org/, including a Shiny demo case. See the User Guide at https://dlmtool.github.io/DLMtool/userguide/introduction.html, and https://cran.r-project.org/web/packages/DLMtool/DLMtool.pdf for a complete list of assessments and management procedures. | Depletion-Based Stock Reduction Analysis | From the package: "Depletion-Based Stock Reduction Analysis (DB-SRA) is a method designed for determining a catch limit and management reference points for data-limited fisheries where catches are known from the beginning of exploitation. User prescribed BMSY/B0, M, FMSY/M are used to find B0 and therefore the a catch limit by back-constructing the stock to match a user specified level of stock depletion. The DB-SRA method of this package isn't exactly the same as the original method of Dick and MacCall (2011) because it has to work for simulated depletions above BMSY/B0 and even on occasion over B0. It also doesn't have the modification for flatfish life histories that has previously been applied by Dick and MacCall (2011)." Other: A combination of stochastic Stock Reduction Analysis and Depletion-Corrected Average Catch, Depletion-Based Stock Reduction Analysis (DB-SRA) uses an extended time series of catch, the species’ approximate natural mortality rate, and the age at maturity to help estimate sustainable yields and management reference points. Probability distributions are provided for key management reference points dealing with yield and biomass; uncertainty is accounted for through Monte Carlo simulation. (ref: Dick, E. J., & MacCall, A. D. (2011). Depletion-based stock reduction analysis: a catch-based method for determining sustainable yields for data-poor fish stocks. Fisheries Research, 110, 331-341. http://dx.doi.org/10.1016/j. fishres.2011.05.007) | Tom Carruthers | University of British Columbia | Yes | Medium | Carruthers, T.R. and Hordyk, A.R. 2018. The Data- Limited Methods Toolkit (DLMtool): An R package for informing management of data- limited populations. Methods in Ecology and Evolution 9: 2388–2395. https://doi.org/10.1111/2041-210X.13081 Description in list at https://cran.r-project.org/web/packages/DLMtool/DLMtool.pdf (Both links last accessed 2/11/2023) | Yes | R | No | Yes | User specified | Method intends that the user is following the female spawning biomass | No | No | No | No | Single area | No | Yes | No | No | No | No | User specified | No | Yes - Monte Carlo; posteriors modified due to filtering process | No | Yes | Yes | Optional - but ideally should be considering total removals | No | No | No | No | No | No | No | No | No | No | No | No | No | No | No (but requires FMSY/M) | No | No | No | No | No | No | No | No | Yes | No | No | No | No | No | No | No | Yes | Yes | B/Bo, BMSY/Bo, FMSY/M | No |
| DB-SRA (fishmethods) | https://cran.r-project.org/web/packages/fishmethods/index.html | Catch only | Single species | Supported and Recommended | Requires a full catch series. Recommended with guidelines based on our test data set. SSS could be an alternative given it has greater flexibility by being based on an age-structured model. However, DB-SRA has more flexibility in the production function | Depletion-Based Stock Reduction Analysis | From the package: "This function estimates MSY from catch following Dick and MacCall (2011)." Other: A combination of stochastic Stock Reduction Analysis and Depletion-Corrected Average Catch, Depletion-Based Stock Reduction Analysis (DB-SRA) uses an extended time series of catch, the species’ approximate natural mortality rate, and the age at maturity to help estimate sustainable yields and management reference points. Probability distributions are provided for key management reference points dealing with yield and biomass; uncertainty is accounted for through Monte Carlo simulation. | Gary A. Nelson | Commonwealth of Massachusetts Division of Marine Fisheries | Unknown | Medium | Dick, E. J., and MacCall, A. D. 2011. Depletion-based stock reduction analysis: a catch-based method for determining sustainable yields for data-poor fish stocks. Fisheries Research 110: 331-341. https://doi.org/10.1016/j.fishres.2011.05.007 (Last accessed 2/11/2023) | Yes | R | No | Yes | User specified | Method intends that the user is following the female spawning biomass | No | No | No | No | Single area | No | Yes | No | No | No | No | User specified | No | Yes - Monte Carlo; posteriors modified due to filtering process | No | Yes | Yes | Optional - but ideally should be considering total removals | No | No | No | No | No | No | No | No | No | No | No | No | No | No | No (but requires FMSY/M) | No | No | No | No | No | No | No | No | Yes | No | No | No | No | No | No | No | Yes | Yes | No | No |
| DD and cDD (DLMtool) | https://github.com/Blue-Matter/DLMtool | Delay difference | Single species | Supported | Assessment within the Management Strategy Evaluation framework, SAMTool. A simple delay-difference assessment with UMSY and MSY as leading parameters that estimates the TAC using a time-series of catches and a relative (abundance) index. A catch and index-based assessment model. Compared to the discrete delay-difference (annual time-step in production and fishing), the delay-differential model (cDD) is based on continuous recruitment and fishing mortality within a time-step. The continuous model works much better for populations with high turnover (e.g. high F or M, continuous reproduction). This model is conditioned on catch and fits to the observed index. In the state-space version (cDD_SS), recruitment deviations from the stock-recruit relationship are estimated. We recommend CASAL as it has more features. | Delay - Difference Stock Assessment | This DD model is observation error only and has does not estimate process error (recruitment deviations). Assumption is that knife-edge selectivity occurs at the age of 50% maturity. Similar to many other assessment models it depends on a host of assumptions such as temporally stationary productivity and proportionality between the abundance index and real abundance. Unsurprisingly the extent to which these assumptions are violated tends to be the biggest driver of performance for this method.The method is conditioned on effort and estimates catch. The effort is calculated as the ratio of catch and index. Thus, to get a complete effort time series, a full time series of catch and index is also needed. Missing values are linearly interpolated. Compared to the discrete delay-difference (DD) (annual time-step in production and fishing), the delay-differential model (cDD) is based on continuous recruitment and fishing mortality within a time-step. The continuous model works much better for populations with high turnover (e.g. high F or M, continuous reproduction). | Tom Carruthers and Adrian Hordyk | University of British Columbia | Yes | Medium | Carruthers, T, Walters, C.J„ and McAllister, M.K. 2012. Evaluating methods that classify fisheries stock status using only fisheries catch data. Fisheries Research 119-120:66-79. Description in list at https://cran.r-project.org/web/packages/DLMtool/DLMtool.pdf. Hilborn, R., and Walters, C. 1992. Quantitative Fisheries Stock Assessment: Choice, Dynamics and Uncertainty. Chapman and Hall, New York. (Chapter 9) Last accessed 2/11/2023) | Yes | R | No | Yes | User specified | Can be sex-specific if inputs are such | No | No | No | No | Single area | No | Yes | No | No | No | No | User specified | Monte Carlo simulations | Yes | No | Yes | Yes | Optional - but ideally should be considering total removals | No | No | No | No | No | No | No | No | No | No | No | No | Yes | No | No | No | No | No | No | No | No | No | No | No | No | No | No | No | No | No | No | Yes | Yes | Estimates TAC using UMSY and MSY as leading parameters. | No |
| DD_SS and cDD_SS (SAMTool) | https://github.com/Blue-Matter/DLMtool | Delay difference | Single species | Supported | Assessment within the Management Strategy Evaluation framework, SAMTool. A simple delay-difference assessment with UMSY and MSY as leading parameters that estimates the TAC using a time-series of catches and a relative (abundance) index. In the state-space version, annual recruitment deviates from the stock-recruit relationship are estimated. We recommend CASAL as it has more features. | Delay - Difference Stock Assessment | This DD model is observation error only and has does not estimate process error (recruitment deviations). Assumption is that knife-edge selectivity occurs at the age of 50% maturity. Similar to many other assessment models it depends on a host of assumptions such as temporally stationary productivity and proportionality between the abundance index and real abundance. Unsurprisingly the extent to which these assumptions are violated tends to be the biggest driver of performance for this method.The method is conditioned on effort and estimates catch. The effort is calculated as the ratio of catch and index. Thus, to get a complete effort time series, a full time series of catch and index is also needed. Missing values are linearly interpolated. Compared to the discrete delay-difference (DD) (annual time-step in production and fishing), the delay-differential model (cDD) is based on continuous recruitment and fishing mortality within a time-step. The continuous model works much better for populations with high turnover (e.g. high F or M, continuous reproduction). | Tom Carruthers and Adrian Hordyk | University of British Columbia | Yes | Medium | Carruthers, T, Walters, C.J„ and McAllister, M.K. 2012. Evaluating methods that classify fisheries stock status using only fisheries catch data. Fisheries Research 119-120:66-79. Description in list at https://cran.r-project.org/web/packages/DLMtool/DLMtool.pdf. (Last accessed 1/11/2023) Hilborn, R., and Walters, C. 1992. Quantitative Fisheries Stock Assessment: Choice, Dynamics and Uncertainty. Chapman and Hall, New York. (Chapter 9) | Yes | R | No | Yes | User specified | Can be sex-specific if inputs are such | No | No | No | No | Single area | No | Yes | No | No | No | No | User specified | Monte Carlo simulations | Yes | No | Yes | Yes | Optional - but ideally should be considering total removals | No | No | No | No | No | No | No | No | No | No | No | No | Yes | No | No | No | No | No | No | No | No | No | No | No | No | No | No | No | No | No | No | Yes | Yes | Estimates TAC using UMSY and MSY as leading parameters. | No |
| DD_TMB (SAMtool) | https://rdrr.io/cran/SAMtool/ | Delay difference | Single species | Supported and Recommended | Not yet widely used. Implemented in TMB. | Delay - Difference Stock Assessment in TMB | "A simple delay-difference assessment model using a time-series of catches and a relative abundance index and coded in TMB. The model is conditioned on effort and estimates predicted catch. In the state-space version, recruitment deviations from the stock-recruit relationship are estimated." | T. Carruthers & Z. Siders. Zach Siders coded the TMB function. | University of British Columbia | No | Medium | Carruthers, T, Walters, C.J,, and McAllister, M.K. 2012. Evaluating methods that classify fisheries stock status using only fisheries catch data. Fisheries Research 119-120:66-79. https://doi.org/10.1016/j.fishres.2011.12.011 (Last accessed 2/11/2023) | Yes | TMB | No | Yes | Annual | No | No | No | No | Yes | Single area | No | No | No | No | No | No | No | Yes | No | No | Yes | No | No | No | Yes | No | No | No | No | No | No | No | No | No | No | Yes | No | No | No | No | No | No | No | No | No | No | No | No | No | Yes | Yes | No | No | No | Yes | No | No | Yes; annual time step |
| DDe (DLMtool) | https://github.com/Blue-Matter/DLMtool | Delay difference | Single species | Supported | A simple delay-difference assessment with UMSY and MSY as leading parameters that estimates EMSY using a time-series of catches and a relative abundance index. We recommend CASAL as it has more features. | Effort-based Delay-Difference Stock Assessment | This DD model is observation error only and has does not estimate process error (recruitment deviations). Assumption is that knife-edge selectivity occurs at the age of 50% maturity. Similar to many other assessment models it depends on a host of assumptions such as temporally stationary productivity and proportionality between the abundance index and real abundance. Unsurprisingly the extent to which these assumptions are violated tends to be the biggest driver of performance for this method. The method is conditioned on effort and estimates catch. The effort is calculated as the ratio of catch and index. Thus, to get a complete effort time series, a full time series of catch and index is also needed. Missing values are linearly interpolated. | Tom Carruthers and Adrian Hordyk | University of British Columbia | Yes | Low | Carruthers, T, Walters, C.J„ and McAllister, M.K. 2012. Evaluating methods that classify fisheries stock status using only fisheries catch data. Fisheries Research 119-120:66-79. Description in list at https://cran.r-project.org/web/packages/DLMtool/DLMtool.pdf. Hilborn, R., and Walters, C. 1992. Quantitative Fisheries Stock Assessment: Choice, Dynamics and Uncertainty. Chapman and Hall, New York. (Chapter 9) (Last accessed 2/11/2023) | Yes | R | No | Yes | User specified | Can be sex-specific if inputs are such | No | No | No | No | Single area | No | Yes | No | No | No | No | User specified | Monte Carlo simulations | Yes | No | Yes | Yes | Optional - but ideally should be considering total removals | No | No | No | No | No | No | No | No | No | No | No | No | Yes | No | No | No | No | No | No | No | No | No | No | No | No | No | No | No | No | No | No | Yes | Yes | Estimates effort at maximum sustainable yield (EMSY) using UMSY and MSY as leading parameters. | No |
| deplet (fishmethods) | https://cran.r-project.org/web/packages/fishmethods/index.html | Depletion model | Single species | Supported | We recommend CatDyn as it has more features. This package use a Leslie or DeLury approach assuming a closed population, whereas CatDyn allows for an open population. SSS is an alternative approach | Depletion analysis | Depletion analyses are typically applied to species with rapid growth rates, short life-spans, little generation overlap and weak or no stock-recruitment relationships (they have been commonly applied to cephalopods). The approach assumes high steepness, a closed population (i.e. negligible recruitment, and immigration/emigration), and, critically, no within-season natural mortality. Depletion analyses are conducted by plotting catch-per-unit-effort (CPUE) versus cumulative catch (i.e. total catch of the season thus far). Assuming linearity, the method extrapolates via linear regression to determine the projected 1) total catch and 2) length of the season. The slope of the regression approximates the catchability. The response would be to limit the season or limit the total catch. | Gary A. Nelson | Commonwealth of Massachusetts Division of Marine Fisheries | Unknown | Low | Delury, D. B. 1947. On the estimation of biological populations. Biometrics 3: 145-167 https://doi.org/10.2307/3001390 (Last accessed 2/11/2023) | Yes | R | No | Yes | User specified | No | No | No | No | No | Single area | Single stock; closed population assumption | Implied | No | No | No | No | User specified | For some of the options | No | No | Yes | Yes | Optional - but ideally should be considering total removals | No | No | No | No | No | No | No | No | No | No | No | No | Yes | Yes | No | No | No | No | No | No | No | No | No | No | No | No | No | No | No | No | No | No | No | Gives estimates of total catch that may be removed, season length, catchability and abundance | Yes; user specified time step |
| FLa4a (FLR) | https://github.com/flr/FLa4a | Integrated assessment | Single species | Inactive | GiHub build status as failing. Examples can not be easily run. SAM, SS or CASAL may be alternatives as they have more features. Designed for ICES and data limited fisheries. | Assessment For All (Fisheries Library in R) | "The stock assessment model framework is a non-linear catch-at-age model implemented in R/FLR/ADMB that can be applied rapidly to a wide range of situations with low parametrization requirements. In the a4a assessment model, the model structure is defined by submodels, which are the different parts of a statistical catch at age model that require structural assumptions. There are 5 submodels in operation: - a model for F-at-age, - a (list) of model(s) for abundance indices catchability-at-age, - a model for recruitment, - a list of models for the observation variance of catch-at-age and abundance indices, - a model for the initial age structure. In practice, we fix the variance models and the initial age structure models, but in theory these can be changed." | Colin Millar, Ernesto Jardim | European Commission Joint Research Centre | Yes | High | Jardim, E., Millar, C. Scott,F., Osio, C. and Mosqueira, I. 2017: http://www.flr-project.org/FLa4a/articles/sca.pdf (Last accessed 2/11/2023) | No | ADMB | No | Yes | Annual | No | No | No | No | No | Single area | No | Yes | Yes | No | Yes | All selectivities which can be described by a R formulae can, in theory, be used. | No | Yes | Yes | No | Yes | No | No | No | Yes | No | No | Yes | No | No | No | No | No | No | No | Yes | No | No | No | Yes | Index of biomass, any index that can be related to recruitment, biomass, fishing mortality or observation variance. | No | No | No | No | No | Yes | Yes | No | Yes | Yes | Yes | Yes | Yes | Yes | No | Done via other FLR packages. | Yes; annual time step |
| FLAssess (FLR) | https://github.com/flr/FLAssess | Integrated assessment | Single species | Superseded | GiHub build status as failing. SAM, SS or CASAL may be alternatives as they have more features. Designed for ICES fisheries. | The Fishery Library in R - Stock Assessment | "FLAssess is the basic structure for age-based stock assessment. It provides a standard class for data input, diagnostic inspection and stock status estimation; either for use within a working group setting or as part of a formal Management Strategy Evaluation (MSE). The FLAssess class can be extended to create specific implementations of assessment methods e.g. FLICA, FLSURBA, FLXSA, providing a common interface for all assessment methods. For example, within ICES there are two main stock assessment methods, ICA for pelagic and XSA for demersal stocks. However, differences between the methods are mainly artefacts of how they were independently developed rather than methodological. By incorporating such methods in a common class this problem will hopefully be avoided in the future. FLAssess also incorporates methods for performing virtual population analysis (VPA) and stock projection." FLR, the MSE framework, is found at: https://github.com/flr/FLAssess | Laurence T. Kell | FLR | No | Medium | Kell, L. T., Mosqueira, I., Grosjean, P., Fromentin, J-M., Garcia, D., Hillary, R., Jardim, E., Mardle, S., Pastoors, M. A., Poos, J. J., Scott, F., and Scott, R. D. 2007. FLR: an open-source framework for the evaluation and development of management strategies. – ICES Journal of Marine Science, 64: 640–646: https://doi.org/10.1093/icesjms/fsm012 (Last accessed 2/11/2023) | Yes | R | No | Yes | Annual | No | No | No | No | No | Single area | No | No | No | No | No | No | No | Yes | No | No | Yes | No | Yes | No | No | No | No | No | No | No | No | No | No | No | No | Yes | No | No | No | No | No | No | No | No | No | No | No | No | No | No | No | No | No | No | No | No | No | Yes; annual time step |
| frasyr | https://github.com/ichimomo/frasyr | VPA | Single species | Not evaluated | Still untested.We recommend SAM if there is a need to apply VPA-like approach | frasyr | "Estimating stock status with stock assessment models and calculating RPs and ABC for Japanese fisheries management" | Hiroshi Okamura, Shota Nishijima, Momoko Ichinokawa | Japan Fisheries Research and Education Agency | No | Medium | Not yet published; Guideline - https://github.com/ichimomo/frasyr (Last accessed 2/11/ 2023) | Some related journal papers | TMB | No | Yes | Annual | No | No | No | No | No | Single area | No | No | No | No | No | No | No | Yes | No | No | Yes | No | No | No | Yes | No | No | Yes | No | No | No | No | No | No | No | Yes | Yes | Yes | Yes | No | No | No | No | No | No | No | Yes | No | No | Yes | Yes | No | Yes | No | No | No | No | Yes; annual time step |
| GADGET | https://github.com/Hafro/gadget2 | Integrated assessment | Multiple species | Supported | Supported, although SS or CASAL may be alternatives as they have more features. Designed for ICES fisheries. Now as R packages gadget2 and gadget3. | Globally applicable Area Disaggregated General Ecosystem Toolbox | "Gadget is a software tool that can run complicated statistical multi-species and multi-area ecosystem models, which take many features of the ecosystem into account. Gadget works by running an internal model based on many parameters, and then comparing the data from the output of this model to ''real'' data to get a goodness-of-fit likelihood score. These parameters can then be adjusted, and the model re-run, until an optimum is found, which corresponds to the model with the lowest likelihood score. Gadget allows you to include a number of features into your model: One or more species, each of which may be split into multiple stocks; multiple areas with migration between areas; predation between and within species; maturation; reproduction and recruitment; multiple commercial and survey fleets taking catches from the populations." | Current: Jamie, Bjarki Thor Elvarsson and William Butler | Marine and Freshwater Research Institute, Iceland | Yes | High | Gadget Userguide (James Begley 2006) ; https://hafro.github.io/gadget2/docs/userguide/ (Last accessed 1/11/2023) | Yes | other auto Diff and TMB | No | Yes | User defined (e.g. monthly, quarterly or irregular intra year time steps) | Yes | Yes | Yes | Yes | Yes | User defined, no limit | Yes | Yes | Yes | No | Yes | No | Yes | Yes | No | No | Yes | Yes | Yes | Yes | Yes | Yes | Yes | Yes | Yes | Yes | Yes | Yes | Yes | Yes | Mean weight at length | Yes | Yes | No | Yes | No | No | Yes | Yes | No | No | No | Yes | Yes | No | Yes | Yes | Yes | Yes | No | Yes | No | No | Yes; seasonal time step |
| GMACS | https://github.com/GMACS-project/GMACS_Assessment_code | Size structured | Single species | Supported | Few size structured packages available. Presently focused on crustaceans. Now have public guide documents and example datasets. Also R code to run and analyse the outputs. | General Model for Assessing Crustacean Stocks | "Gmacs is a statistical size-structured population modeling framework designed to be flexible, scalable, and useful for both data-limited and data-rich situations. As most of the standard assessment models, it allows to determine the impact fishing on both the historical and the current abundance of the population and to evaluate sustainable rate of removals (i.e., catches). The framework can incorporate multiple data types from a variety of sources (fisheries, surveys) by combing all of them in the form of an integrated analysis (Maunder and Punt, 2013; Punt et al., 2013)). This approach allows various kinds of data with different (and sometimes incomplete) collection histories to provide complementary information about fished stocks." | Jim Ianelli, D’Arcy Webber, Cody Szuwalski, Jack Turnock, Jie Zheng, Hamachan Hamazaki, Athol Whitten, Andre Punt, David Fournier, John Levitt | NOAA, UoW | No | High | Gmacs: mastering a modeling framework to assess Crustacean species https://gmacs-project.github.io/User-manual/index.html (last accessed 1/11/2023) | Yes | ADMB | No | Yes | Flexible (with annual) | Yes | No | No | Yes | No | Single area | No | Yes | Yes | No | No | No | Yes | Yes | Yes | No | Yes | Yes | Yes | Yes | No | No | No | No | No | No | No | No | No | No | No | Yes | Yes | No | Yes | No | No | No | Yes | No | No | No | No | Yes | No | Yes | No | No | Yes | No | Yes | No | No | Yes; seasonal time step |
| JABBA | https://github.com/jabbamodel/JABBA | Surplus production | Single species | Supported and Recommended | State space model. Recommended, with guidelines based on our test data set. For selectivity option see JABBA-Select. | Just Another Bayesian Biomass Assessment | "Just Another Bayesian Biomass Assessment" (JABBA) can be used for biomass dynamic stock assessment applications, and has emerged from the development of a Bayesian State-Space Surplus Production Model framework, already applied in stock assessments of sharks, tuna, and billfishes around the world. JABBA presents a unifying, flexible framework for biomass dynamic modelling, runs quickly, and generates reproducible stock status estimates and diagnostic tools. Specific emphasis has been placed on flexibility for specifying alternative scenarios, achieving high stability and improved convergence rates. Default JABBA features include: 1) an integrated state-space tool for averaging and automatically fitting multiple catch per unit effort (CPUE) time series; 2) data-weighting through estimation of additional observation variance for individual or grouped CPUE; 3) selection of Fox, Schaefer, or Pella-Tomlinson production functions; 4) options to fix or estimate process and observation variance components; 5) model diagnostic tools; 6) future projections for alternative catch regimes; and 7) a suite of inbuilt graphics illustrating model fit diagnostics and stock status results. " | Henning Winker, Felipe Carvalho, Maia Kapur | Forestry and Fisheries South Africa | No | Medium | doi.org/10.1016/j.fishres.2018.03.010 | Yes | JAGS, R | No | Yes | Annual | No | No | No | No | No | Single area | No | No | No | No | No | Production model so none explicit | No | No | Yes | Yes | Yes | Yes | No | No | No | No | No | No | No | No | No | No | No | No | No | Yes | No | No | No | No | No | No | No | No | No | No | Yes | No | No | No | No | No | No | No | Yes | Yes | No | Yes; annual time step |
| LBRP | https://github.com/shcaba/LBRP | Length-based | Single species | Supported | Can deal with aggregated size data. Otherwise LBSPR (barefootecologist), LIME or SS-CL are recommended. SS-CL is the most flexible. | Analysis of sustainability indicators based on length-based reference points (LBRP) | This is an assessment option based on length-based reference points (LBRP). It was developed by Cope and Punt in 2009 and offers a more robust extension of the Froese (2004) assessment using size-based indicators. When establishing length-based reference points for sustainable management, Cope and Punt highlight the importance of distinguishing the selectivity pattern. They show that Froese's (2004) size indicators (Pmat, Popt, and Pmega), when used in isolation, can take on a wide range of values for an overfished stock. As such, they may not adequately reflect sustainable fishing practices. Instead, Cope and Punt suggest the use of Pobj, defined as the sum of the 3 size indicators used in the Froese (2004) assessment model. In their assessment model based on length-based reference points, Cope and Punt present a decision tree (Figure 10) that allows users to determine whether a stock's biomass is below a target or limit reference point using Pobj, the 3 catch proportions used in the 2004 model, and the ratio of Lmat/Lopt. The decision tree does not require fishing mortality rate (F), recruitment compensation (h), or spawning biomass data, and it should be used in concert with the size indicators used in the 2004 model when possible. (ref: Froese, R. 2004. Keep it simple: Three indicators to deal with overfishing. Fish and Fisheries 5:86– 91.) | Jason Cope and Andre Punt | NOAA, University of Washington | Yes | Low | Cope, J. M., and Punt, A.E. 2009. Length-based reference points for data-limited situations: Applications and restrictions. Marine and Coastal Fisheries 1(1):169-186. http://dx.doi.org/10.1577/C08-025.1 (Last accessed 2/11/2023) | Yes | R | No | Yes | User specified | Method intends that the user is following the female spawning biomass | No | No | No | No | Single area | No | Yes | No | No | No | No | User specified | No | No | No | No | No | No | Yes (in lieu of age composition data) | No | No | No | No | No | No | No | No | Yes | No | No | No | No | No | No | No | No | No | No | No | No | No | No | No | No | No | No | No | No | No | Yes | Yes | Estimates relative stock status | No |
| LBSPR | https://github.com/AdrianHordyk/LBSPR/blob/master/vignettes/LBSPR.R | Length-based | Single species | Supported and Recommended | Recommended, with guidelines based on our test data set. LBSPR is an equilibrium method, whereas LIME and SS-LO (SS-DL) are non-equilibrium approaches. | Length-Based Spawning Potential Ratio | From the package: "Simulates expected equilibrium length composition, yield-per-recruit, and the spawning potential ratio (SPR) using the length-based SPR (LBSPR) model. Fits the LBSPR model to length data to estimate selectivity, relative apical fishing mortality, and the spawning potential ratio for data-limited fisheries." Other: The length-based spawning potential ratio (LB-SPR) assessment method estimates spawning potential ratio (SPR), the ratio of reproductive potential of a fished relative to an unfished population. In total, the method requires at least on year of length composition information, an estimate for the ratio M/k, maximum size (Linf), the coefficient of variation (CV) of Linf, and knowledge of size-at-maturity, from which SPR is calculated. The ratio of M/k is used because this value is less variable across stocks and species than either the individual parameters for natural mortality rate (M) or the von Bertalanffy growth coefficient (k). | Adrian Hordyk | University of British Columbia | No | Low | Hordyk, A., Ono, K., Prince, J.D., and Walters, C.J. 2016. A simple length-structured model based on life history ratios and incorporating size-dependent selectivity: application to spawning potential ratios for data-poor stocks. Can. J. Fish. Aquat. Sci. 73(12): 1787-1799. https://doi.org/10.1139/cjfas-2015-0422 (Last accessed 2/11/2023) | Yes | R | No | Yes | User specified | Method is intended to be used on female data and using female life history parameters | No | No | No | No | Single area | No | Yes | No | No | No | No | User specified | Yes | Flagged for future (current Monte Carlo stochastic version) | No | No | No | No | Yes | No | No | No | No | No | No | No | No | Yes | No | No | No | No | No | No | No | No | No | No | No | No | No | No | No | Yes | No | No | No | No | No | Yes | Yes | Estimates F/M | No |
| LBSPR (barefootecologist) | http://barefootecologist.com.au/lbspr | Length-based | Single species | Supported and Recommended | LBSPR is an equilibrium method, whereas LIME and SS-LO (SS-DL) are non-equilibrium approaches. | Length-based spawner potential ratio | From the package: "The LBSPR method has been developed for data-limited fisheries, where few data are available other than a representative sample of the size structure of the vulnerable portion of the population (i.e., the catch) and an understanding of the life history of the species. The LBSPR method does not require knowledge of the natural mortality rate (M), but instead uses the ratio of natural mortality and the von Bertalanffy growth coefficient (K) (M/K), which is believed to vary less across stocks and species than M (Prince et al. 2015). Like any assessment method, the LBSPR model relies on a number of simplifying assumptions. In particular, the LBSPR models are equilibrium based, and assume that the length composition data is representative of the exploited population at steady state." (ref: Prince, J.D., Hordyk, A.R., Valencia, S.R., Loneragan, N.R. and Sainsbury, K.J. 2015. Revisiting the concept of Beverton–Holt life-history invariants with the aim of informing data-poor fisheries assessment. ICES J. Mar. Sci. 72: 194-203 .) | Adrian Hordyk and Jeremy Prince | Murdoch University, Biospherics | Yes | Low | Hordyk, A., Ono, K., Prince, J.D., and Walters, C.J. 2016. A simple length-structured model based on life history ratios and incorporating size-dependent selectivity: application to spawning potential ratios for data-poor stocks. Can. J. Fish. Aquat. Sci. 73(12): 1787-1799. https://doi.org/10.1139/cjfas-2015-0422 (Last accessed 2/11/2023) | Yes | R-Shiny | No | R-Shiny package | User specified | Method is intended to be used on female data and using female life history parameters | No | No | No | No | Single area | No | Yes | No | No | No | No | User specified | Yes | Flagged for future (current Monte Carlo stochastic version) | No | No | No | No | Yes | No | No | No | No | No | No | No | No | Yes | No | No | No | No | No | No | No | No | No | No | No | No | No | No | No | Yes | No | No | No | No | No | Yes | Yes | Estimates F/M | No |
| LBSPR (DLMtool) | https://github.com/Blue-Matter/DLMtool | Length-based | Single species | Supported | Recommend LBSPR (barefootecologist), LIME, SS-LO (SS-DL). SS-LO (SS-DL) is the most flexible. LBSPR is an equilibrium method, whereas LIME and SS-LO (SS-DL) are non-equilibrium approaches. See the User Guide at https://dlmtool.github.io/DLMtool/userguide/introduction.html, and https://cran.r-project.org/web/packages/DLMtool/DLMtool.pdf for a complete list of assessments and management procedures. | Length-based spawner potential ratio | The length-based spawning potential ratio (LB-SPR) assessment method estimates spawning potential ratio (SPR), the ratio of reproductive potential of a fished relative to an unfished population. In total, the method requires at least on year of length composition information, an estimate for the ratio M/k, maximum size (Linf), the coefficient of variation (CV) of Linf, and knowledge of size-at-maturity, from which SPR is calculated. The ratio of M/k is used because this value is less variable across stocks and species than either the individual parameters for natural mortality rate (M) or the von Bertalanffy growth coefficient (k). | Quang Huynh, Tom Carruthers, Adrian Hordyk | University of British Columbia | Yes | Low | Hordyk, A., Ono, K., Prince, J.D., and Walters, C.J. 2016. A simple length-structured model based on life history ratios and incorporating size-dependent selectivity: application to spawning potential ratios for data-poor stocks. Can. J. Fish. Aquat. Sci. 73(12): 1787-1799. https://doi.org/10.1139/cjfas-2015-0422 (Last accessed 2/11/2023) | Yes | R | No | Yes | User specified | Method is intended to be used on female data and using female life history parameters | No | No | No | No | Single area | No | Yes | No | No | No | No | User specified | Yes | Flagged for future (current Monte Carlo stochastic version) | No | No | No | No | Yes | No | No | No | No | No | No | No | No | Yes | No | No | No | No | No | No | No | No | No | No | No | No | No | No | No | Yes | No | No | No | No | No | Yes | Yes | Estimates F/M | No |
| LIME | https://github.com/merrillrudd/LIME | Length-based | Single species | Supported and Recommended | Recommended, with guidelines based on our test data set. Can be used with catches. Non-equilibrium approach. The SS-LO (SS-DL) and SS-CL (SS-DL) alternative worth considering as a Rshiny web driven version | Length-based Integrated Mixed Effects (LIME) | From the package: "Developed by Rudd and Thorson (2017), Length-based Integrated Mixed Effects (LIME) is a flexible stock assessment method for fisheries with developing data collection programs and/or limited capacity for monitoring. For these fisheries, it is often easier to collect length measurements from fishery catch than to quantify total catch. Conventional stock assessment tools that rely on length measurements without total catch do not directly account for variable fishing mortality and recruitment over time. However, this equilibrium assumption is likely violated in almost every fishery, degrading estimation performance. LIME is an extension of length-only approaches that accounts for time-varying recruitment and fishing mortality." | Merrill Rudd and James Thorson | University of Washington | No | Low | Rudd, MB and Thorson, JT. 2017. Accounting for variable recruitment and fishing mortality in length-based stock assessments for data-limited fisheries. Canadian Journal of Fisheries and Aquatic Sciences https://doi.org/10.1139/cjfas-2017-0143. (Last accessed 2/11/2023) | Yes | R | No | Yes | User specified | Method is intended to be used on female data and using female life history parameters | No | No | No | No | Single area | No | Yes | No | No | No | No | User specified | Yes | Yes | Yes | Optional | Optional | Optional - but ideally should be considering total removals | Yes | No | No | No | No | No | No | No | No | Yes | No | No | Optional | No | No | No | No | No | No | No | No | No | No | Yes | No | Yes | No | No | No | No | No | Yes | Yes | No | No |
| MLZ | https://cran.r-project.org/web/packages/MLZ/index.html | Mean length | Multiple species | Supported | This can be useful in situations where only mean length data are available. Can now also include CPUE. Otherwise we recommend LBSPR (barefootecologist), LIME or SS-DL. SS-DL is the most flexible. | Mean Length-Based Estimators of Mortality using TMB | "MLZ is a package that facilitates data preparation and estimation of mortality with statistical diagnostics using the mean length-based mortality estimator and several extensions." | Quang Huynh, Todd Gedamke, Amy Then | UBC | No | Medium | Gedamke, T. and Hoenig, J.M. (2006), Estimating Mortality from Mean Length Data in Nonequilibrium Situations, with Application to the Assessment of Goosefish. Transactions of the American Fisheries Society, 135: 476-487. |
Yes | TMB | No | Yes | Annual | No | No | No | No | No | Single area | No | No | No | No | No | No | No | Yes | No | No | No | No | No | No | No | No | No | No | Yes | No | No | No | No | No | No | Yes | No | No | No | No | No | No | No | No | No | No | No | No | No | No | No | No | No | No | Yes | No | No | No |
| MS-cMSY | https://github.com/cfree14/datalimited2 | Catch only | Multiple species | Inactive | Look at our "Supported and Recommended" Catch only versions (cMSY, COM-SIR, DB-SRA, OCOM, SS-COM, SSS, zBRT), as they are updated more regularly, are used more extensively within Australia or are more recent. Note: This model is still in beta version. | Multispecies Catch MSY | Estimates stock status (B/BMSY) time series for multispecies fisheries from time series of catch and estimates of resilience using the multispecies cMSY (MS-cMSY) method of Free et al. (in prep). Note: this model is still in beta version. | Christopher M. Free | Sustainable Fisheries Group, Bren School, UC Santa Barbara, CA, USA | No | Low | Free CM, Rudd MB, Kleisner KM, Thorson JT, Longo C, Minto C, Jensen OP (in prep) Multispecies catch-only models for assessing data-limited fisheries. (Checked 2/11/2023: still in prep) | Yes | R | No | Yes | User specified | No: there is no differentiation between sexes in r and K, and no other biological input | No, but multi-species catches | No | No | No | Single area | No | Implied | No | No | No | No | User specified | No | Yes - Monte Carlo; posteriors modified due to filtering process | No | Yes | Yes | Optional - but ideally should be considering total removals | No | No | No | No | No | No | No | No | No | No | No | No | No | No | No | No | No | No | No | No | No | No | No | Yes | No | No | No | No | No | No | No | Yes | Yes | No | No |
| Multifan-CL | http://www.multifan-cl.org/index.php?option=com_content&view=category&id=2&Itemid=101 | Integrated assessment | Single species | Supported and Recommended | Designed for fisheries where primary data sources are tagging and length data. Can account for spatial structure. | MULTIFAN-CL | "MULTIFAN-CL MULTIFAN-CL is a computer program that implements a statistical, length-based, age-structured model for use in fisheries stock assessment. The model is a convergence of two previous approaches. The original MULTIFAN model (Fournier et al. 1990) provided a method of analysing time series of length-frequency data using statistical theory to provide estimates of von Bertalanffy growth parameters and the proportions-at-age in the length-frequency data. The model and associated software were developed as an analytical tool for fisheries in which large-scale age sampling of catches was infeasible or not cost effective, but where length-frequency sampling data were available. MULTIFAN provided a statistically-based, robust method of length-frequency analysis that was an alternative to several ad hoc methods being promoted in the 1980s." | Nick Davies, David Fournier, Fabrice Bouyé, John Hampton and Arni Magnusson. | Otter Research Ltd and Pacific Community (SPC) | No | High | Fournier, D.A., Hampton, J., and Sibert, J.R. (1998). MULTIFAN-CL: a length-based, age-structured model for fisheries stock assessment, with application to South Pacific albacore, Thunnus alalunga.(pdf - 287k) Canadian Journal of Fisheries and Aquatic Sciences 55, 2105-2116. https://www.researchgate.net/publication/240671683_MULTIFAN-CL_A_length-based_age-structured_model_for_fisheries_stock_assessment_with_application_to_South_Pacific_albacore_Thunnus_alalunga. (Last accessed 2/11/2023). Nick Davies, David Fournier, Fabrice Bouyé, John Hampton and Arni Magnusson. Developments in the Multifan-CL software 2022-23. https://meetings.wcpfc.int/node/19367 (last accessed 1/11/2023) | Hampton, J., and D.A. Fournier. (2001). A spatially disaggregated, length-based, age-structured population model of yellowfin tuna (Thunnus albacares) in the western and central Pacific Ocean.(pdf - 4502k) Marine and Freshwater Research 52, 937-963. | other auto Diff | No | Yes | Flexible both for fisheries and recruitment/age structure | Yes | No | No | Yes | Yes | Can be flexibly specified | Yes | Yes | Yes | No | Yes | No | No | Yes | No | No | Yes | Yes | Yes | Yes | Yes | Yes | Yes | No | No | Yes | No | No | Yes | No | No | Yes | Yes | No | No | Yes | No | Yes | No | No | No | No | Yes | Yes | No | No | Yes | Yes | Yes | Yes | Yes | Yes | No | Yes; seasonal time step |
| OCOM | https://github.com/cfree14/datalimited2 | Catch only | Single species | Supported and Recommended | Similar to DB-SRA but OCOM depletion values comes from analysis of catch time trends as opposed to being an input value. Possible to also consider SSS. | Optimised Catch-only Method | From the package: "The "optimized catch-only model" (OCOM) developed by Zhou et al. (2017) employs a stock reduction analysis (SRA) using priors for r and stock depletion derived from natural mortality and saturation estimated using the Zhou-BRT method, respectively." Other: The Optimized Catch-Only Method (OCOM) uses time series of catches and two priors - one for the intrinsic population growth rate derived from life history parameters, and another for stock depletion based on catch trends. The estimated parameters include carrying capacity, intrinsic population growth rate, maximum sustainable yield, and depletion. OCOM also estimates biomass, fishing mortality, and stock status (B/BMSY, F/MSY), and biological/management quantities (i.e., r,k, MSY, BMSY,FMSY) from a time series of catch and a natural mortality (M). | Christopher M. Free | Sustainable Fisheries Group, Bren School, UC Santa Barbara, CA, USA | Unknown | Low | Zhou S, Punt AE, Smith ADM, Ye Y, Haddon M, Dichmont CM, Smith DC (2017b) An optimised catch-only assessment method for data poor fisheries. ICES Journal of Marine Science: https://doi.org/10.1093/icesjms/fsx226 (Last accessed 2/11/2023) | Yes | R | No | Yes | User specified | No | No | No | No | No | Single area | No | Implied | No | No | No | No | User specified | Uses R function "optimize": The method used is a combination of golden section search and successive parabolic interpolation, and was designed for use with continuous functions. | No | No | Yes | Yes | Optional - but ideally should be considering total removals | No | No | No | No | No | No | No | No | No | No | No | No | No | No | No | No | No | No | No | No | No | No | No | Yes | No | No | No | No | No | No | No | Yes | Yes | Estimates biomass, fishing mortality, and stock status (B/BMSY, F/MSY) time series and biological/management quantities (i.e., r,k, MSY, BMSY,FMSY) | No |
| SAM | https://github.com/fishfollower/SAM | Integrated assessment | Single species | Supported and Recommended | Preferred method because it is based on a state-space estimation method. Designed for ICES fisheries, but is being applied globally. User expertise needs to be quite high, especially if being applied outside of the ICES assessment process. This package can be used in R or within a web interface (https://www.stockassessment.org/login.php). The latter have active examples with associated data and code. | State-space Assessment Model | SAM is a State-Space stock assessment model that uses the mixed effects strength of Template Model Builder (TMB) to formulate a flexible stock assessment. It is most widely used in ICES assessments, but use in tunas and elsewhere are becoming more common. It can be used standalone in a web application, in R and as part of the FisheriesLibrary in R (FLR) | Anders Nielsen, Casper Berg, Christoffer Albertsen, Kasper Kristensen, Venessa Trijoulet, Olav Brevik, Mollie Brooks | DTU Aqua and others | Yes | High | Nielsen, A., Hintzen, N.T., Mosegaard, H., Trijoulet, V., and Berg, C.W. 2021. Multi-fleet state-space assessment model strengthens confidence in single-fleet SAM and provides fleet-specific forecast options. ICES Journal of Marine Science, 78(6): 2043–20521. https://academic.oup.com/icesjms/article-abstract/78/6/2043/6317566. (Last accessed 1//11/2023). | Yes | TMB | Yes | Yes | Annual (default) | No | No | No | Yes | No | Single area | No | No | No | No | No | Random process for F implies time varying selectivity | No | Yes | No | Yes | Yes | Yes | Yes | No | Yes | No | No | No | No | No | No | No | No | No | No | Yes | No | No | Yes | No | No | Yes | No | No | No | No | No | Yes | No | No | No | No | No | No | No | No | No | Yes; annual time step |
| SCA (SAMtool) | https://rdrr.io/cran/SAMtool/ | Integrated assessment | Single species | Superseded | SS or CASAL may be alternatives as they have more features. | Statistical Catch at Age | "A generic statistical catch-at-age model (single fleet, single season) that uses catch, index, and catch-at-age composition data. SCA parameterizes R0 and steepness as leading productivity parameters in the assessment model. Recruitment is estimated as deviations from the resulting stock-recruit relationship. In SCA2, the mean recruitment in the time series is estimated and recruitment deviations around this mean are estimated as penalized parameters (similar to Cadigan 2016). The standard deviation is set high so that the recruitment is almost like free parameters. Unfished and MSY reference points are inferred afterwards from the assessment output (SSB and recruitment estimates). SCA_Pope is a variant of SCA that fixes the expected catch to the observed catch, and Pope's approximation is used to calculate the annual harvest rate (U). In SCA2, no stock-recruit relationship is assumed in the assessment model, i.e., annual recruitment is estimated as deviations from the mean recruitment over the observed time series, similar to Cadigan (2016). After the assessment, a stock-recruit function can be fitted post-hoc to the recruitment and spawning stock biomass estimates from the assessment model to obtain MSY reference points." | SAMtool: Quang Huynh, Tom Carruthers, Adrian Hordyk | University of British Columbia | No | High | Cadigan, N.G. 2016. A state-space stock assessment model for northern cod, including under-reported catches and variable natural mortality rates. Canadian Journal of Fisheries and Aquatic Science 72:296-308. https://doi.org/10.1139/cjfas-2015-0047. Last accessed 1/11/2023 | No | R | No | Yes | Annual | No | No | No | No | No | Single area | No | Yes | Yes | No | No | No | No | Yes | No | No | Yes | No | No | No | Yes | No | No | No | No | No | No | No | No | No | No | Yes | No | No | No | No | No | No | No | No | No | No | Yes | Yes | No | No | No | No | No | No | No | No | No | Yes; annual time step |
| SCA2 (SAMtool) | https://rdrr.io/cran/SAMtool/f/vignettes/SCA.Rmd | Integrated assessment | Single species | Superseded | SAM, SS or CASAL may be alternatives as they have more features. Designed for used in management startegy evaluation and simulation testing of estimation methods. | Statistical Catch at Age 2 | "A generic statistical catch-at-age model (single fleet, single season) that uses catch, index, and catch-at-age composition data. SCA parameterizes R0 and steepness as leading productivity parameters in the assessment model. Recruitment is estimated as deviations from the resulting stock-recruit relationship. In SCA2, the mean recruitment in the time series is estimated and recruitment deviations around this mean are estimated as penalized parameters (similar to Cadigan 2016). The standard deviation is set high so that the recruitment is almost like free parameters. Unfished and MSY reference points are inferred afterwards from the assessment output (SSB and recruitment estimates). SCA_Pope is a variant of SCA that fixes the expected catch to the observed catch, and Pope's approximation is used to calculate the annual harvest rate (U). In SCA2, no stock-recruit relationship is assumed in the assessment model, i.e., annual recruitment is estimated as deviations from the mean recruitment over the observed time series, similar to Cadigan (2016). After the assessment, a stock-recruit function can be fitted post-hoc to the recruitment and spawning stock biomass estimates from the assessment model to obtain MSY reference points." | SAMtool: Quang Huynh, Tom Carruthers, Adrian Hordyk | University of British Columbia | No | High | Cadigan, N.G. 2016. A state-space stock assessment model for northern cod, including under-reported catches and variable natural mortality rates. Canadian Journal of Fisheries and Aquatic Science 72:296-308. https://doi.org/10.1139/cjfas-2015-0047 (Last accessed 2/11/2023) | No | R | No | Yes | Annual | No | No | No | No | No | Single area | No | Yes | Yes | No | No | No | No | Yes | No | No | Yes | No | No | No | Yes | No | No | No | No | No | No | No | No | No | No | Yes | No | No | No | No | No | No | No | No | No | No | Yes | Yes | No | No | No | No | No | No | No | No | No | Yes; annual time step |
| Schaefer Biomass dynamics (FISHE) | http://fishe.edf.org/ | Surplus production | Single species | Superseded | We recommend use of JABBA and spm. | Primer for Biomass Dynamics Method – Schaefer Depletion Estimators (Framework for Integrated Stock and Habitat Evaluation) | In the simplest sense, all populations change from year to year based on how many how many are born and how many die. The same general principles apply when looking at fish stock biomass, where the biomass of fish available in any given year can be determined by the biomass that existed last year, which is then increased by the biomass of "recruits and the growth in overall biomass over the year and decreased by the amount of biomass that dies from both natural mortality and catch (Hilborn and Walters, 1992)." From the FISHE page: "The SPM model we provide in the downloadable Workbook, and linked here, is for the Schaefer model, which assumes the population is at equilibrium." To use the FISHE resources, one needs to download the Excel FISHE Workbook (link under "Resources" or "About"); then under "Step 9 - Additional Fishery Assessments"; then under dropdown "Surplus Production" click the link "Surplus Production Assessment Method Worksheet" (under heading "Resources"). For guidance, click the link, "Primer for Schaefer Surplus Production Method". | FISHE team | Environmental Defense Fund | No | Medium | Hilborn R., and C.J. Walters. 1992. Quantitative Fisheries Stock Assessment: Choice, Dynamics, & Uncertainty. Chapman and Hall, New York. https://link.springer.com/book/10.1007/978-1-4615-3598-0 (Last accessed 2/11/2023) | Yes | Excel | No | No | Annual | No | No | No | No | No | Single area | No | No | No | No | No | No | No | No | No | No | Yes | No | No | No | No | No | No | No | No | No | No | No | No | No | No | Yes | No | Yes | No | No | No | No | No | No | No | No | Yes | Yes | No | No | Yes | Yes | No | No | Yes | No | No | No |
| SP (SAMtool) | https://github.com/Blue-Matter/SAMtool | Surplus production | Single species | Superseded | We recommend use of JABBA and spm. | Surplus-production (SP) model (SAMtool) | "A surplus production model that uses only a time-series of catches and a relative abundance index and coded in TMB. The base model, SP, is conditioned on catch and estimates a predicted index. Continuous surplus production and fishing is modeled with sub-annual time steps which should approximate the behavior of ASPIC (Prager 1994). The Fox model, SP_Fox, fixes BMSY/K = 0.37 (1/e). The state-space version, SP_SS estimates annual deviates in biomass. An option allows for setting a prior for the intrinsic rate of increase. The function for the spict model (Pedersen and Berg, 2016) is available in MSEextra." | Quang Huynh | UBC | No | Medium | Fletcher, R.I. 1978. On the restructuring of the Pella-Tomlinson system. Fishery Bulletin 76:515-521. | Unknown | R | No | Yes | Annual | No | No | No | No | No | Single area | No | No | No | No | No | No | No | Yes | No | No | Yes | No | No | No | No | No | No | No | No | No | No | No | No | No | No | Yes | No | No | No | No | No | No | No | No | No | No | Yes | Yes | No | No | Yes | No | No | No | Yes | No | No | No |
| SP_SS (SAMtool) | https://github.com/Blue-Matter/SAMtool | Surplus production | Single species | Superseded | We recommend use of JABBA and spm. Been migrated from MSEtool to SAMtool. | Surplus-production State-space version (SP_SS) model (SAMtool) | "A surplus production model that uses only a time-series of catches and a relative abundance index and coded in TMB. The base model, SP, is conditioned on catch and estimates a predicted index. Continuous surplus production and fishing is modeled with sub-annual time steps which should approximate the behavior of ASPIC (Prager 1994). The Fox model, SP_Fox, fixes BMSY/K = 0.37 (1/e). The state-space version, SP_SS estimates annual deviates in biomass. An option allows for setting a prior for the intrinsic rate of increase. The function for the spict model (Pedersen and Berg, 2016) is available in MSEextra." | Quang Huynh | UBC | No | Medium | Fletcher, R.I. 1978. On the restructuring of the Pella-Tomlinson system. Fishery Bulletin 76:515-521. | Unknown | R | No | Yes | Annual | No | No | No | No | No | Single area | No | No | No | No | No | No | No | Yes | No | Yes | Yes | No | No | No | No | No | No | No | No | No | No | No | No | No | No | Yes | No | No | No | No | No | No | No | No | No | No | Yes | Yes | No | No | Yes | No | No | No | Yes | No | No | No |
| SPICT | https://github.com/DTUAqua/spict | Surplus production | Single species | Supported and Recommended | The package uses Template Model Builder which is a better framework for modern assessments. | Surplus Production model in Continuous Time | "An R-package for fitting surplus production models in continuous-time to fisheries catch data and biomass indices (either scientific or commercial). Main advantages of spict are: 1. All estimated reference points (MSY, Fmsy, Bmsy) are reported with uncertainties. 2. The model can be used for short-term forecasting and management strategy evaluation. 3. The model is fully stochastic in that observation error is included in catch and index observations, and process error is included in fishing and stock dynamics. 4. The model is formulated in continuous-time and can therefore incorporate arbitrarily sampled data." | T.K. Mildenberger, A. Kokkalis, C.W. Berg | DTU Aqua | No | Medium | Mildenberger, Tobias K, Casper W Berg, Martin W Pedersen, Alexandros Kokkalis, and J Rasmus Nielsen. 2019. “Time-variant productivity in biomass dynamic models on seasonal and long-term scales.” ICES Journal of Marine Science, September. https://doi.org/10.1093/icesjms/fsz154. | Yes | TMB, R | No | Yes | Continuous | No | No | No | No | No | Single area | No | No | No | No | No | No | Yes | Yes | No | No | Yes | Yes | Yes | No | No | No | No | No | No | No | No | No | No | No | No | Yes | No | No | No | No | No | No | No | No | No | No | Yes | Yes | No | No | Yes | No | No | No | Yes | Yes | No | Yes, with shorter time step as long as surplus production approach applies |
| spm (datalowSA) | https://github.com/haddonm/datalowSA | Surplus production | Single species | Supported and Recommended | Deterministic model with observation error. Recommended, with guidelines based on our test data set. We recommend users try JABBA first. | Surplus Production Modelling | From the package: "Surplus production models are one of the simplest analytical methods available that provides for a full fish stock assessment of the population dynamics of the stock being examined." | Malcolm Haddon | Formerly CSIRO, now private | Yes | Medium | Haddon, M. Burch, P., Dowling, N., and Little, R. 2019. Reducing the Number of Undefined Species in Future Status of Australian Fish Stocks Reports: Phase Two - training in the assessment of data-poor stocks. FRDC Final Report 2017/102. CSIRO Oceans and Atmosphere and Fisheries Research Development Corporation. Hobart 125 p. https://www.frdc.com.au/Archived-Reports/FRDC%20Projects/2017-102-DLD.pdf (Last accessed 2/11/2023) | No | R | No | Yes | Annual | No | No | No | No | No | Single area | No | No | No | No | No | No | No | Yes | No | No | Yes | No | No | No | No | No | No | No | No | No | No | No | No | No | No | Yes | No | Yes | Yes | No | No | No | No | No | No | No | Yes | Yes | No | No | Yes | Yes | No | No | No | No | No | No |
| spm (MQMF) | haddonm/MQMF: An R package to accompany the new book 'Using R for Modelling and Quantitative Methods in Fisheries' (github.com) | Surplus production | Single species | Supported | Deterministic model with observation error. We recommend users try JABBA and SPiCT first. | Surplus Production Modelling | Surplus production models (alternatively Biomass Dynamic models; Hilborn and Walters, 1992) pool the overall effects of recruitment, growth, and mortality (all aspects of production) into a single production function dealing with undifferentiated biomass (or numbers). The term “undifferentiated” implies that all aspects of age and size composition, along with gender and other differences, are effectively ignored. | Malcolm Haddon | Formerly CSIRO, now private | Yes | Medium | https://haddonm.github.io/URMQMF Chapter 7 Surplus Production Models | Using R for Modelling and Quantitative Methods in Fisheries (haddonm.github.io) (Last accessed 2/11/2023) | No | R | No | Yes | Annual | No | No | No | No | No | Single area | No | No | No | No | No | No | No | Yes | No | No | Yes | No | No | No | No | No | No | No | No | No | No | No | No | No | No | Yes | No | Yes | No | No | No | No | No | No | No | No | Yes | Yes | No | No | Yes | Yes | No | No | No | Yes | No | No |
| spm (SRAPLUS) | https://github.com/DanOvando/sraplus | Surplus production | Single species | Supported and Recommended | Recently released. Has more versatility than standard SRA - allows users to combine a biomass dynamics model with a variety of data sources. When fitting to an abundance index, the model is a reasonably robust way of incorporating priors into the surplus production model. | sraplus | sraplus is a flexible assessment package based developed in Ovando et al. 2021. sraplus is an extension of stochastic stock reduction analysis (SRA) (Kimura et al., 1984; Walters et al., 2006), which allows users to combine a biomass dynamics model with a variety of data sources (e.g. priors on recent stock status or an index of abundance) in order to produce estimates of the state of a fishery over time. sraplus can be run in two forms: either as a stock reduction analysis (SRA), or fit to an index of abundance (fishery dependent or independent). Unless there is an abundance index to fit to, the model runs as an SRA. The key goal of sraplus is not substantial improvements in model fitting methods per say, but providing the ability to easily incorporate multiple kinds of fishery data potentially used in SRA-style analyses in a statistically rigorous manner. At the most “data limited” end, the model approximates the behavior of catch-msy, sampling from prior distributions to obtain parameter values that given a catch history do not crash the population and satisfy supplied priors on initial and final depletion. At the most data rich end (i.e., this application), the model can be fit to an abundance index or catch-per-unit-effort data, while incorporating priors on recent stock status based on Fisheries Management Index (FMI) scores or swept-area ratio data. See https://danovando.github.io/sraplus/ . When fitting to an abundance index, the model is a reasonably robust way of incorporating priors into the surplus production model. | Dan Ovando | University of Washington | Yes | Medium | Ovando, D., Hilborn, R., Monnahan, C., Rudd, M., Sharma, R., Thorson, J.T., Rousseau, Y., Ye, Y., 2021. Improving estimates of the state of global fisheries depends on better data. Fish and Fisheries n/a. https://doi.org/10.1111/faf.12593 See also https://danovando.github.io/sraplus/ (both links last accessed 2/11/23) | Yes | R | Yes | Yes | Annual | No | No | No | No | No | Single area | No | No | No | No | No | No | No | Yes | Yes | No | Yes | Yes | Optional - but ideally should be considering total removals | No | No | No | No | No | No | No | No | No | No | No | No | Yes | Yes | No | No | No | No | No | No | No | No | No | Yes | Yes | No | No | Yes | No | No | No | Yes | Yes | Estimates Depletion, B/BMSY, C/MSY,U/UMSY | No |
| SPMSY (DLMtool) | https://github.com/Blue-Matter/DLMtool | Surplus production | Single species | Supported | We recommend JABBA and SPiCT for surplus production modelling. This function uses Martell and Froese (2012) method for estimating MSY to determine the overfishing limit (OFL). | Catch trend Surplus Production MSY | An MP that uses Martell and Froese (2012) method for estimating MSY to determine the OFL. This function uses Martell and Froese's (2012) method for estimating MSY to determine the overfishing limit (OFL). Since their approach estimates stock trajectories based on catches and a rule for intrinsic rate of increase it also returns depletion. Given their surplus production model predicts K, r and depletion it is straight forward to calculate the OFL based on the Schaefer productivity curve. The method requires the assumption that catch is proportional to abundance, and a catch time-series from the beginning of exploitation. | Tom Carruthers and Adrian Hordyk | University of British Columbia | Yes | Low | Martell, S. and Froese, R. 2012. A simple method for estimating MSY from catch and resilience. Fish and Fisheries. DOI: 10.1111/j.1467-2979.2012.00485.x (Last accessed 2/11/2023) | Yes | R | No | Yes | User specified | Can be sex-specific if inputs are such | No | No | No | No | Single area | No | Yes | No | No | No | No | User specified | Monte Carlo simulations | Yes | No | Yes | Yes | Optional - but ideally should be considering total removals | No | No | No | No | No | No | No | No | No | No | No | No | No | No | No | No | No | No | No | No | No | No | No | No | No | No | No | Yes | No | No | No | Yes | Yes | Estimates depletion (D), unfished biomass (K), and r, the intrinsic rate of population increase. The management procedure calcuates a TAC as: TAC = DK r/2 | No |
| spSPRA (DLMtool) | https://github.com/Blue-Matter/DLMtool | Catch only | Single species | Supported | Stock Reduction Analysis is alternative method to CMSY based on an age-structured model. SSS is an alternative for this method. This package contains surplus production SRA (SPSRA) - a surplus production equivalent of DB-SRA that uses a demographically derived prior for intrinsic rate of increase (McAllister method), and age-composition stock reduction analysis. | Surplus Production Stock Reduction Analysis | Stochastic Stock Reduction Analysis (SRA) is a stochastic age-structured population model that uses the Beverton-Holt stock-recruitment function to estimate stock status forward in time (Walters et al., 2006). This assessment method uses maximum sustainable yield (MSY) and Umsy (the annual exploitation rate producing MSY at equilibrium) as leading parameters. Given these parameters, the model simulates changes in biomass by subtracting estimates of mortality and adding recruits. A single trajectory of biomass over time is produced, as well as estimates of MSY, Umsy, exploitation in the terminal year, and stock status. | Tom Carruthers and Adrian Hordyk | University of British Columbia | Yes | Low | Walters, C.J., Martell, S. J. D., and Korman, J. 2006. A stochastic approach to stock reduction analysis. Canadian Journal of Fisheries and Aquatic Sciences 63:212-223. https://doi.org/10.1139/f05-213 (Last accessed 2/11/2023) | Yes | R | No | Yes | User specified | Can be sex-specific if inputs are such | No | No | No | No | Single area | No | Yes | No | No | No | No | User specified | Monte Carlo simulations | Yes | No | Yes | Yes | Optional - but ideally should be considering total removals | No | No | No | No | No | No | No | No | No | No | No | No | No | No | No | No | No | No | No | No | No | No | No | Yes | No | No | No | No | No | No | No | Yes | Yes | Model produces estimates of MSY, Umsy, exploitation in the terminal year, and stock status | No |
| SRA (SRAPLUS) | https://github.com/DanOvando/sraplus | Catch only | Single species | Supported and Recommended | Recently released. Has more versatility than standard SRA - allows users to combine a biomass dynamics model with a variety of data sources. The "catch only " mode runs as an SRA - it is essentially a CMSY clone, but with more prior options and transparency about the location of the information content. | sraplus | sraplus is a flexible assessment package based developed in Ovando et al. 2021. sraplus is an extension of stochastic stock reduction analysis (SRA) (Kimura et al., 1984; Walters et al., 2006), which allows users to combine a biomass dynamics model with a variety of data sources (e.g. priors on recent stock status or an index of abundance) in order to produce estimates of the state of a fishery over time. sraplus can be run in two forms: either as a stock reduction analysis (SRA), or fit to an index of abundance (fishery dependent or independent). Unless there is an abundance index to fit to, the model runs as an SRA. The key goal of sraplus is not substantial improvements in model fitting methods per say, but providing the ability to easily incorporate multiple kinds of fishery data potentially used in SRA-style analyses in a statistically rigorous manner. At the most “data limited” end (i.e., this application), the model approximates the behavior of catch-msy, sampling from prior distributions to obtain parameter values that given a catch history do not crash the population and satisfy supplied priors on initial and final depletion. It is essentially a CMSY clone, with more prior options and better transparency around where the information content of the "assessment" is (i.e., in the absence of nothing but catches and life history, your priors are the assessment). At the most data rich end the model can be fit to an abundance index or catch-per-unit-effort data, while incorporating priors on recent stock status based on Fisheries Management Index (FMI) scores or swept-area ratio data. See https://danovando.github.io/sraplus/ | Dan Ovando | University of Washington | Yes | Medium | Ovando, D., Hilborn, R., Monnahan, C., Rudd, M., Sharma, R., Thorson, J.T., Rousseau, Y., Ye, Y., 2021. Improving estimates of the state of global fisheries depends on better data. Fish and Fisheries n/a. https://doi.org/10.1111/faf.12593 See also https://danovando.github.io/sraplus/ (both links last accessed 2/1/2023) | Yes | R | Yes | Yes | Annual | No | No | No | No | No | Single area | No | No | No | No | No | No | No | Yes | Yes | No | Yes | Yes | Optional - but ideally should be considering total removals | No | No | No | No | No | No | No | No | No | No | No | No | No | No | No | No | No | No | No | No | No | No | No | Yes | Yes | No | No | Yes | No | No | No | Yes | Yes | Estimates Depletion, B/BMSY, C/MSY,U/UMSY | No |
| SS | https://vlab.noaa.gov/web/stock-synthesis; https://github.com/nmfs-stock-synthesis/stock-synthesis/releases | Integrated assessment | Single species | Supported and Recommended | Preferred model because it is the most general model with extensive documentation, diagnostics, flexibility, testing and scalability. Applied globally. | Stock Synthesis | "Stock Synthesis provides a statistical framework for calibration of a population dynamics model using a diversity of fishery and survey data. It is designed to accommodate both age and size structure in the population and with multiple stock sub-areas. Selectivity can be cast as age specific only, size-specific in the observations only, or size-specific with the ability to capture the major effect of size-specific survivorship. The overall model contains subcomponents which simulate the population dynamics of the stock and fisheries, derive the expected values for the various observed data, and quantify the magnitude of difference between observed and expected data. Some SS features include ageing error, growth estimation, spawner-recruitment relationship, movement between areas. SS is most flexible in its ability to utilize a wide diversity of age, size, and aggregate data from fisheries and surveys. The ADMB C++ software in which SS is written searches for the set of parameter values that maximize the goodness-of-fit, then calculates the variance of these parameters using inverse Hessian and MCMC methods. A management layer is also included in the model allowing uncertainty in estimated parameters to be propagated to the management quantities, thus facilitating a description of the risk of various possible management scenarios, including forecasts of possible annual catch limits. The structure of Stock Synthesis allows for building of simple to complex models depending upon the data available." | Richard Methot and others | NOAA | Yes | High | Methot, R.D. (Jr) and Wetzel, C.R. 2013. Stock synthesis: A biological and statistical framework for fish stock assessment and fishery management. Fisheries Research. 142: 86-99: https://doi.org/10.1016/j.fishres.2012.10.012. (Last accessed 2/11/2023) | Yes | C++ with ADMB | Yes | Yes | Customizable | Yes | No | Yes | Yes | Yes | Flexible | No | Yes | Yes | No | Yes | Knife-edge; logistic-exponential | Yes | Yes | Yes | Yes | Yes | Yes | Yes | Yes | Yes | Yes | Yes | Yes | Yes | Yes | Yes | Yes | Yes | Yes | No | Yes | Yes | Yes | Yes | Yes | No | Yes | No | No | No | No | Yes | Yes | Yes | Yes | Yes | Yes | Yes | Yes | Yes | Yes | No | Yes; seasonal time step |
| SS-CL (SS-DL) | https://github.com/shcaba/SS-DL-tool | Length-based | Single species | Supported and Recommended | Recommended for cases with catch, length and index data. The SS-DL Tool can use a variety of data configurations and is flexible in accommodating any available combination of information. Here, SS-CL can be set up to look like LBSPR. Can be used with catch data. | Stock Synthesis - Catch or Length only (Stock Synthesis Data-limited Tool) | Stock Synthesis fitted only to length data. Catch data can be included in the analysis if estimates of biomass as well as SPR are required. Computes biomass (if catches are provided), depletion, and catch limits from standard harvest control rules | Merrill Rudd, Chantel Wetzel, and Jason Cope | NOAA | No | Medium | Rudd MB, Cope JM, Wetzel CR and Hastie J (2021) Catch and Length Models in the Stock Synthesis Framework: Expanded Application to Data-Moderate Stocks. Frontiers in Marine Sciene 8:663554. https://doi.org/10.3389/fmars.2021.663554 (Last accessed 2/11/2023) | Yes | ADMB, R, Rshiny | Yes | Yes | User specified | Yes | No | Yes | No | No | Single area | No | Yes | Yes | Yes | Yes | No | User specified | Yes | No | No | Optional - but ideally should be considering total removals | Optional - but ideally should be considering total removals | Optional - but ideally should be considering total removals | Yes | No | No | No | No | No | Yes | Yes | No | Yes | No | No | No | No | No | No | No | No | No | No | No | No | No | Yes | Yes | Yes | Yes | Yes | Yes | Yes | Yes | Yes | Yes | No | No |
| SS-COM | https://github.com/datalimited/datalimited | Catch only | Single species | Supported and Recommended | Special case of the catch only approach as it depends on a effort model that assumes effort changes as a linear function of biomass. Includes process and observation error. SSS is an alternative for this method | State-space Catch Only Model | Combines effort dynamics and population dynamics models to estimate maximum sustainable yield (MSY) and stock status based on a series of catches and assumed linear effort dynamics relative to the logarithm of biomass. | Sean Anderson | Pacific Biological Station, Fisheries and Oceans Canada, Nanaimo, British Columbia | Unknown | Low | Thorson, J. T., Minto, C., Minte-Vera, C.V., Kleisner, K.M. and Longo, C. 2013. A New Role for Effort Dynamics in the Theory of Harvested Populations and Data-Poor Stock Assessment. Canadian Journal of Fisheries and Aquatic Sciences 70(12): 1829–1844. https://doi.org/10.1139/cjfas-2013-0280 (Last accessed 2/11/2023) | Yes | R | No | Yes | User specified | Can be sex-specific if inputs are such | No | No | No | No | Single area | No | Yes | No | No | No | No | User specified | Yes | Yes, with MCMC sampling to approximate posterior | Yes | Yes | Yes | Optional - but ideally should be considering total removals | No | No | No | No | No | No | Yes | No | No | No | No | No | No | Yes | No | No | No | No | No | No | No | No | No | Yes | No | No | No | No | No | No | No | Yes | Yes | Estimates MSY, B/BMSY, F/MSY | No |
| SS-DL’s fully integrated stock assessment (SS-DL) | https://github.com/shcaba/SS-DL-tool | Integrated assessment | Single species | Supported and Recommended | See Stock Synthesis (SS). SS underpins SS-DL. SS-DL makes it easier to set up SS due to its user-friendly interface. The SS-DL Tool can use a variety of data configurations and is flexible in accommodating any available combination of information. | Stock Synthesis within SS-DL. | "Stock Synthesis provides a statistical framework for calibration of a population dynamics model using a diversity of fishery and survey data. It is designed to accommodate both age and size structure in the population and with multiple stock sub-areas. Selectivity can be cast as age specific only, size-specific in the observations only, or size-specific with the ability to capture the major effect of size-specific survivorship. The overall model contains subcomponents which simulate the population dynamics of the stock and fisheries, derive the expected values for the various observed data, and quantify the magnitude of difference between observed and expected data. Some SS features include ageing error, growth estimation, spawner-recruitment relationship, movement between areas. SS is most flexible in its ability to utilize a wide diversity of age, size, and aggregate data from fisheries and surveys. The ADMB C++ software in which SS is written searches for the set of parameter values that maximize the goodness-of-fit, then calculates the variance of these parameters using inverse Hessian and MCMC methods. A management layer is also included in the model allowing uncertainty in estimated parameters to be propagated to the management quantities, thus facilitating a description of the risk of various possible management scenarios, including forecasts of possible annual catch limits. The structure of Stock Synthesis allows for building of simple to complex models depending upon the data available." | Richard Methot and others | NOAA | Yes | High | Methot, R.D. (Jr) and Wetzel, C.R. 2013. Stock synthesis: A biological and statistical framework for fish stock assessment and fishery management. Fisheries Research. 142: 86-99: https://doi.org/10.1016/j.fishres.2012.10.012 (Last accessed 2/11/2023) | Yes | ADMB, R, Rshiny | Yes | Yes | Customizable | Yes | No | Yes | Yes | Yes | Flexible | No | Yes | Yes | No | Yes | Knife-edge; logistic-exponential | Yes | Yes | Yes | Yes | Yes | Yes | Yes | Yes | Yes | Yes | Yes | Yes | Yes | Yes | Yes | Yes | Yes | Yes | No | Yes | Yes | Yes | Yes | Yes | No | Yes | No | No | No | No | Yes | Yes | Yes | Yes | Yes | Yes | Yes | Yes | Yes | Yes | No | No |
| SS-LO (SS-DL) | https://github.com/shcaba/SS-DL-tool | Length-based | Single species | Supported and Recommended | Recommended for cases with length only data. In cases where only age data are available, or age data are available together with length data, this method could also be used. The SS-DL Tool can use a variety of data configurations and is flexible in accommodating any available combination of information. Here, SS-LO can be set up to look like LBSPR and LIME and is therefore versatile. | Stock Synthesis - Length only (Stock Synthesis Data-limited Tool) | Stock Synthesis fitted only to length data. Catch data can be included in the analysis if estimates of biomass as well as SPR are required. Computes biomass (if catches are provided), depletion, and catch limits from standard harvest control rules | Merrill Rudd, Chantel Wetzel, and Jason Cope | NOAA | No | Medium | Rudd MB, Cope JM, Wetzel CR and Hastie J (2021) Catch and Length Models in the Stock Synthesis Framework: Expanded Application to Data-Moderate Stocks. Frontiers in Marine Sciene 8:663554. https://doi.org/10.3389/fmars.2021.663554 (Last accessed 2/11/2023) | Yes | ADMB, R, Rshiny | Yes | Yes | User specified | Yes | No | Yes | No | No | Single area | No | Yes | Yes | Yes | Yes | No | User specified | Yes | No | No | Optional - but ideally should be considering total removals | Optional - but ideally should be considering total removals | Optional - but ideally should be considering total removals | Yes | Yes - optional. Can apply method with only age data if length-frequency data not available | No | Optional | No | No | Yes | Yes | Optional | Yes | No | No | No | No | No | No | No | No | No | No | No | No | No | Yes | Yes | Yes | Yes | Yes | Yes | Yes | Yes | Yes | Yes | No | No |
| SSS | https://github.com/shcaba/SSS | Catch only | Single species | Supported and Recommended | There are several forms of SS. Simple Stock Synthesis (SSS) is an age-structured version of other catch-only methods such as DBSRA and CMSY. | Simple Stock Synthesis | Simple Stock Synthesis (SSS) is a version of Stock Synthesis (SS) that has been modified to behave as a catch-only approach (similar to DB-SRA), while also becoming a first step towards building a fully implemented quantitative stock assessment. Developed to mimic the Depletion-Based Stock Reduction Analysis (DB-SRA) estimation of overfishing limits (OFLs) currently applied to data-limited U.S. west coast groundfish species, SSS-MC uses Monte Carlo draws of natural mortality, steepness, and stock depletion, and estimates initial recruitment, while SSS-MCMC estimates natural mortality, steepness, and initial recruitment while fitting to an artificial abundance survey representing stock depletion with an error distribution equivalent to the stock depletion prior used in DB-SRA. | Jason Cope | NOAA | Yes | Medium | Cope, J. M. (2013). Implementing a statistical catch-at-age model (Stock Synthesis) as a tool for deriving overfishing limits in data-limited situations Fisheries Research 142: 3-14. http://dx.doi.org/10.1016/j.fishres.2012.03.006 (Last accessed 2/11/2023) | Yes | R | No | Yes | User specified | Yes | No | Yes | No | No | Single area | No | Yes | Yes | Yes | Yes | No | User specified | No | Monte Carlo | No | Yes | Yes | Optional - but ideally should be considering total removals | No | No | No | No | No | No | Yes | Yes | No | Yes | Yes | No | Yes | Yes | No | No | No | No | No | No | No | No | No | Yes | No | No | No | No | Yes | No | No | Yes | Yes | No | No |
| SSS (SAMtool) | https://github.com/Blue-Matter/SAMtool | Catch only | Single species | Supported and Recommended | See https://cran.r-project.org/web/packages/SAMtool/SAMtool.pdf. In SAMtool, SSS is an implementation of SCA_Pope with fixed final depletion (in terms of total biomass, not spawning biomass) assumption. A simple age-structured model (SCA_Pope) is fitted to a time series of catch going back to unfished conditions. Terminal depletion (ratio of current total biomass to unfished biomass) is by default fixed to 0.4. Selectivity is fixed to the maturity ogive, although it can be overridden with the start argument. The sole parameter estimated is R0 (unfished recruitment), with no process error. | Simple Stock Synthesis | Simple Stock Synthesis (SSS) is a version of Stock Synthesis (SS) that has been modified to behave as a catch-only approach (similar to DB-SRA), while also becoming a first step towards building a fully implemented quantitative stock assessment. Developed to mimic the Depletion-Based Stock Reduction Analysis (DB-SRA) estimation of overfishing limits (OFLs) currently applied to data-limited U.S. west coast groundfish species, SSS-MC uses Monte Carlo draws of natural mortality, steepness, and stock depletion, and estimates initial recruitment, while SSS-MCMC estimates natural mortality, steepness, and initial recruitment while fitting to an artificial abundance survey representing stock depletion with an error distribution equivalent to the stock depletion prior used in DB-SRA. | Jason Cope | NOAA | Yes | Medium | Cope, J. M. (2013). Implementing a statistical catch-at-age model (Stock Synthesis) as a tool for deriving overfishing limits in data-limited situations Fisheries Research 142: 3-14. http://dx.doi.org/10.1016/j.fishres.2012.03.006 (Last accessed 2/11/2023) | Yes | R | No | Yes | User specified | Yes | No | Yes | No | No | Single area | No | Yes | Yes | Yes | Yes | No | User specified | No | Monte Carlo | No | Yes | Yes | Optional - but ideally should be considering total removals | No | No | No | No | No | No | Yes | Yes | No | Yes | Yes | No | Yes | Yes | No | No | No | No | No | No | No | No | No | Yes | No | No | No | No | Yes | No | No | Yes | Yes | No | No |
| SSS (SS-DL) | https://github.com/shcaba/SS-DL-tool | Catch only | Single species | Supported and Recommended | There are several forms of SS. Simple Stock Synthesis (SSS) is an age-structured version of other catch-only methods such as DBSRA and CMSY. | Simple Stock Synthesis (Stock Synthesis Data-limited Tool) | This is a RShiny version of the stand alone SSS. Simple Stock Synthesis (SSS) is a version of Stock Synthesis (SS) that has been modified to behave as a catch-only approach (similar to DB-SRA), while also becoming a first step towards building a fully implemented quantitative stock assessment. Developed to mimic the Depletion-Based Stock Reduction Analysis (DB-SRA) estimation of overfishing limits (OFLs) currently applied to data-limited U.S. west coast groundfish species, SSS-MC uses Monte Carlo draws of natural mortality, steepness, and stock depletion, and estimates initial recruitment, while SSS-MCMC estimates natural mortality, steepness, and initial recruitment while fitting to an artificial abundance survey representing stock depletion with an error distribution equivalent to the stock depletion prior used in DB-SRA. | Jason Cope | NOAA | Yes | Medium | Cope, J. M. (2013). Implementing a statistical catch-at-age model (Stock Synthesis) as a tool for deriving overfishing limits in data-limited situations Fisheries Research 142: 3-14. http://dx.doi.org/10.1016/j.fishres.2012.03.006 (Last accessed 2/11/2023) | Yes | ADMB, R, Rshiny | Yes | Yes | User specified | Yes | No | Yes | No | No | Single area | No | Yes | Yes | Yes | Yes | No | User specified | No | Monte Carlo | No | Yes | Yes | Optional - but ideally should be considering total removals | No | No | No | No | No | No | Yes | Yes | No | Yes | Yes | No | Yes | Yes | No | No | No | No | No | No | No | No | No | Yes | No | No | No | No | Yes | No | No | Yes | Yes | No | No |
| STATCAM | https://noaa-fisheries-integrated-toolbox.github.io/STATCAM | Integrated assessment | Single species | Inactive | SAM, SS or CASAL may be alternatives as they have more features. | Statistical Catch at Age Model | "STATCAM is a statistical catch-at-age model. It is a likelihood-based assessment model for joint analyses of age-specific fishery and survey data. Age-structured population stock dynamics are modeled using standard forward-projection methods for statistical catch-at-age analyses. The population dynamics model is fit to observed fishery and survey data using an iterative maximum likelihood estimation approach. The calculation engine was developed by Dr. Jon Brodziak, NMFS Pacific Islands Fishery Science Center, using AD Model Builder." STATCAM is placed as Inactive on the NOAA Toolbox where Stock Synthesis is recommended instead. | Jon Brodziak | NMFS Pacific Islands Fishery Science Center | No | High | STATCAM. 2005. Statistical catch at age model, version 1.3. NOAA Fisheries Toolbox. NEFSC, Woods Hole, MA. | Yes | ADMB | Yes | No | Annual | No | No | No | No | No | Single area | No | Yes | Yes | No | No | No | No | Yes | Yes | No | Yes | Yes | Yes | Yes | Yes | No | No | No | No | Yes | No | Yes | No | No | No | Yes | No | No | No | No | No | No | No | No | No | No | Yes | Yes | No | Yes | Yes | No | Yes | No | Yes | Yes | No | Yes; annual time step |
| WHAM | https://github.com/timjmiller/wham | Integrated assessment | Single species | Supported | One of a few state-space replacement of ASAP with time- and age-varying processes with environmental links. Also consider SAM, SS or CASAL. | Woods Hole Assessment Model | "The Woods Hole Assessment Model (WHAM) is a state-space age-structured stock assessment model that can include environmental effects on population processes. WHAM can be configured to estimate a range of assessment models from a traditional statistical catch-at-age (SCAA) model with recruitments as (possibly penalized) fixed effects, SCAA with recruitments as random effects, or abundance at all ages treated as random effects. WHAM is a generalization of the R and TMB code from Miller et al. (2016), Miller and Hyun 2018, and Miller et al. 2018. WHAM has many similarities to ASAP (code, Legault and Restrepo 1999), including the input data file structure. Many of the plotting functions for input data, results, and diagnostics are modified from ASAP code written by Chris Legault and Liz Brooks (ASAPplots)." | Tim Miller, Brian Stock | NOAA/NEFSC | No | High | Timothy J. Miller, Jonathan A. Hare, Larry A. Alade. 2016. A state-space approach to incorporating environmental effects on recruitment in an age-structured assessment model with an application to southern New England yellowtail flounder. Canadian Journal of Fisheries and Aquatic Sciences, 2016, 73:1261-1270, https://doi.org/10.1139/cjfas-2015-0339. Also, Stock, B and Miller, T.J. 2021. The Woods Hole Assessment Model (WHAM): A general state-space assessment framework that incorporates time- and age-varying processes via random effects and links to environmental covariates. https://doi.org/10.1016/j.fishres.2021.105967 (last accessed 1/11/2023) | Yes | TMB | No | Yes | Annual | No | No | No | No | No | Single area | No | Yes | No | No | Yes | Double logistic | No | Yes | Yes | Yes | No | No | No | No | No | No | No | No | No | No | No | No | No | No | No | No | No | No | No | No | No | No | No | No | No | No | Yes | Yes | No | Yes | Yes | No | Yes | No | Yes | No | Internal estimation of reference points and projections to propagate error in inputs | Yes; annual time step |
| XSSA | https://github.com/johnrsibert/XSSA | Integrated assessment | Single species | Inactive | We recommend Multifan-CL, SS or CASAL | State-space Stock Assessment with "off-line coupling" | "Development of state-space stock assessment models for application to open systems where the stock under analysis is connected to a wider population. The preliminary applications is the yellowfin tuna population which supports fisheries in the Main Hawaiian Islands. The MHI population is connected to a larger tuna population for which stock assessments are available. The estimated population size in areas surrounding the MHI used to "force" the population dynamics." | John Silbert | Joint Institute of Marine and Atmospheric Research, University of Hawai'i at Manoa, Honolulu, HI 96822 U.S.A. | No | Medium | John Silbert. 2015. Stock assessment models for the Main Hawaiian Islands yellowfin tuna fishery. https://github.com/johnrsibert/XSSA/blob/master/Reports/xssa.pdf (Last accessed 1/11/2023). | No | ADMB,TMB | No | Yes | quarter, annual | No | No | No | No | Yes | Single area | No | No | No | No | No | No | No | Yes | No | Yes | Yes | No | No | No | No | No | No | No | No | No | No | No | No | No | No | No | No | No | No | No | No | No | No | No | No | No | No | No | No | No | No | No | No | No | No | No | No | Yes; seasonal time step |
| XSSS | https://github.com/chantelwetzel-noaa/XSSS | Integrated assessment | Single species | Supported | Recommended for catch plus index cases. There are several forms of SSS - SS-CL is appropriate for cases with catch and length data; XSSS is appropriate for catch and index data. However, the package is challenging to use. | Extended Simple Stock Synthesis | This approach builds on Simple Stock Synthesis (SSS) (see description of the SSS assessment method for more details) by incorporating an index of abundance. The index is used to help refine the user specified stock status priors by using adaptive importance sampling to update the posterior stock status with the information provided by the abundance index. By using the Stock Synthesis modelling framework, XSSS, like SSS, allows for flexibility in exploring uncertainty in any life history parameter, as the number of fleets and their associated selectivity values. The main application is to estimate a sustainable catch. | Jason Cope and Chantel Wetzel | NOAA | Yes | High | Wetzel, C.R., and Punt, A.E. 2015. Evaluating the performance of data-moderate and catch-only assessment methods for U.S. west coast groundfish. Fisheries Research 171: 170-187. https://www.sciencedirect.com/science/article/pii/S016578361500185X (Last accessed 2/11/2023) | Yes | R | No | Yes | User specified | Yes | No | Yes | No | No | Single area | No | Yes | Yes | Yes | Yes | No | User specified | Yes | Yes | No | Yes | Yes | Optional - but ideally should be considering total removals | No | No | No | No | No | No | Yes | Yes | No | Yes | Yes | No | Yes | Yes (if CPUE is being used as proxy abundance index) | No | Yes | No | Requires a prior on depletion | No | No | No | No | No | Yes | No | No | No | No | Yes | No | No | Yes | Yes | No | No |
| XSSS (SS-DL) | https://github.com/shcaba/SS-DL-tool | Integrated assessment | Single species | Supported and Recommended | Recommended for catch plus index cases, where the index is less informative (this approach places a prior on the depletion). The SS-DL Tool can use a variety of data configurations and is flexible in accommodating any available combination of information. This particular formation uses catch and index data, and a prior on depletion to supplement the potential lack of information on the index. | Extended Simple Stock Synthesis | This approach builds on Simple Stock Synthesis (SSS) (see description of the SSS assessment method for more details) by incorporating an index of abundance, although the latter is not informative enough to enable the use of an age-structured production model. Rather, the index is used to help refine the user specified stock status priors by using adaptive importance sampling (AIS) to update the posterior stock status with the information provided by the abundance index. By using the Stock Synthesis modelling framework, XSSS, like SSS, allows for flexibility in exploring uncertainty in any life history parameter, as the number of fleets and their associated selectivity values. The main application is to estimate a sustainable catch. | Jason Cope and Chantel Wetzel | NOAA | Yes | Medium | Wetzel, C.R., and Punt, A.E. 2015. Evaluating the performance of data-moderate and catch-only assessment methods for U.S. west coast groundfish. Fisheries Research 171: 170-187. https://www.sciencedirect.com/science/article/pii/S016578361500185X (Last accessed 2/11/2023) | Yes | ADMB, R, Rshiny | Yes | Yes | User specified | Yes | No | Yes | No | No | Single area | No | Yes | Yes | Yes | Yes | No | User specified | Yes | Yes | No | Yes | Yes | Optional - but ideally should be considering total removals | No | No | No | No | No | No | Yes | Yes | No | Yes | Yes | No | Yes | Yes (if CPUE is being used as proxy abundance index) | No | Yes | No | Requires a prior on depletion | No | No | No | No | No | Yes | No | No | No | No | Yes | No | No | Yes | Yes | No | No |
| Z estimate | https://cran.r-project.org/web/packages/MLZ/vignettes/MLZ.html | Mean length | Single species | Supported | This can be useful in situations when only mean length data are available. Otherwise we recommend LBSPR (barefootecologist), LIME or SS-CL. SS-CL is the most flexible. | Non-equilibrium mean length mortality estimator | To estimate total mortality (Z) for a fished stock, the original Beverton-Holt mortality estimator used the von Bertalanffy growth parameters (K and L∞), the length at first capture (Lc), and the mean length of the catch. However, this method was rightly criticized for its reliance on equilibrium conditions. This is because Z can change for a variety of reasons, such as in response to increased fishing pressure or environmental changes. In response to such criticism, Gedamke and Hoenig (2006) developed a new procedure for estimating Z reliably (and also, therefore, fishing mortality rate [F]) in non-equilibrium conditions (i.e., when the stock has experienced different Z values throughout its history). Users must specify how many times mortality is thought to have changed, initial guesses of the years during which mortality is thought to have changed, and the original von Bertalanffy parameters K, L∞, Lc, and mean length to estimates Z and F. From there, maximum likelihood estimation (MLE) is used to calculate variable values with an associated confidence interval, so uncertainty is partially accounted for. | Quang C. Huynh, Todd Gedamke and John Hoenig | Mer Consultants, Virginia Institute of Marine Science | No | Low | Gedamke, T., and Hoenig, J. M. 2006. Estimating mortality from mean length data in nonequilibrium situations, with application to the assessment of goosefish. Transactions of the American Fisheries Society 135: 476-487. http://dx.doi.org/10.1577/T05-153.1 (Last accessed 2/11/2023) | Yes | Unknown | Unknown | Unknown | User specified | No; but user should undertake sex-specific analysis if sex-specific life history available | No | No | No | No | Single area | No | Yes | No | No | No | No | User specified | Yes | No | No | No | No | No | No | No | No | No | No | Yes | No | No | No | Yes | No | No | No | No | Yes | No | No | No | No | No | No | No | No | No | No | No | No | No | No | No | No | Yes | Yes | Estimates total mortality, Z, from which fishing mortality, F, can be derived. | No |
| zBRT | https://github.com/cfree14/datalimited2 | Catch only | Single species | Supported and Recommended | Can be used for methods that require a depletion prior. | Zhou Boosted Regression Tree | From the package: "Estimates saturation (B/K) and stock status (B/BMSY) time series from a time series of catch using the boosted regression tree (BRT) model from Zhou et al. 2017." Other: This assessment option uses a Boosted Regression Tree (BRT) approach to infer stock depletion status based only on a time series of catch data. The method uses 8 predictors of depletion status based on linear regressions of scaled catch (i.e., the catch in a given year divided by the maximum historical catch). Although this assessment method only performs well for heavily fished stocks (a problem faced in any catch-only method), results can be used to provide depletion priors for other data-limited assessments or to directly estimate the probability that depletion is below a threshold. | Shijie Zhou (method); Christopher Free (package) | CSIRO (Zhou), Sustainable Fisheries Group, Bren School, UC Santa Barbara, CA, USA (Free) | No | Low | Zhou S., Punt, A. E., Ye, Y., Ellis, N., Dichmont, C.M., Haddon, M., Smith, D.C. and Smith, A.D.M. 2017. Estimating stock depletion level from patterns of catch history. Fish and Fisheries 18(4): 742-751. https://doi.org/10.1111/faf.12201 (Last accessed 2/11/2023) | Yes | R | No | Yes | User specified | No | No | No | No | No | Single area | No | Implied | No | No | No | No | User specified | Regression tree | No | No | Yes | Yes | Optional - but ideally should be considering total removals | No | No | No | No | No | No | No | No | No | No | No | No | No | No | No | No | No | No | No | No | No | No | No | No | No | No | No | No | No | No | No | Yes | Yes | Estimates saturation (B/K) and stock status (B/BMSY) time series | No |
| Name | Type | Single.multiple.spp | Package status | Expertise | Programming.language | GUI | Sex.structure | Multi.species.technical.interactions | Tagging | Area.structure | Maximum.likelihood | Bayesian |
Name:
Web.link:
Type:
Single.multiple.spp:
Package status:
Comment:
FullName:
Description:
Developers:
Organization:
Training:
Expertise:
Citation:
Peer.reviewed:
Programming.language:
GUI:
R.package:
Temporal.resolution:
Sex.structure:
Multi.species.technical.interactions:
Growth.platoons:
Tagging:
Area.structure:
Spatial.resolution:
Stock.structure:
Logistic:
Double.normal:
Spline.1:
Parameter.for.each.age.nonparametric:
Other.21:
Seasonal:
Maximum.likelihood:
Bayesian:
Random.effects.state.space:
Catch:
Retained:
Discarded:
Length.composition:
Age.composition:
Weight.composition:
Conditional.age.at.length:
Mean.weight.at.age:
Mean.length.at.age:
Sex:
Morph.composition:
Aging.error:
Custom.composition.bin.size:
Stock.origin:
Other.3:
Index.of.abundance:
Index.of.effort:
Fishing.mortality:
Absolute.estimate.of.abundance:
Environmental.index..of.a.parameter.random.effect.:
Other.4:
Mark.recapture..to.estimate.movement.and.or.F.or.B.:
Growth.increment:
Close.kin:
Gene.tagging..Maybe.some.special.requirements.:
Other.5:
MSY:
FMSY:
SPRx:
Spawning.biomass.per.recruit:
Biomass.target:
Dynamic.B0:
Random.deviates:
Normal.approximation:
Parameter.uncertainty:
Fishery.impact.plots:
Other.29:
Short-lived species: